Basic Data Preparation Challenges
- By Gil Raviv
- 4/8/2019
Handling Dates
One of the most common data preparation challenges is dealing with data types. While text columns are easy to handle, numbers and dates can make even the simplest datasets daunting for analysis. In this section you will learn how to handle dates and times. You will start with a common challenge—converting text to dates—and then move on to more challenging cases involving invalid dates. At the end of this section you will learn how to extract specific date or time elements from date/time values.
When you load a table with dates or date/time values, Power Query converts the relevant columns to their correct date/time format. In Exercise 2-4, you imported a dataset with a Date/Time column. Power Query automatically converted the Date column to Date/Time. Exercise 2-5 shows how Power Query handles a column with mixed date formats.
Exercise 2-5: Handling Multiple Date Formats
Download the workbook C02E05.xlsx from https://aka.ms/DataPwrBIPivot/downloads and save it in C:\Data\C02. This workbook contains the AdventureWorks product catalog, with the release date of each product in the last column. Imagine that different data entry teams had typed the products’ release dates in five different formats:
7/1/2018
2018-07-01
7.1.2018
Jul 1, 2018
1 July, 2018
For the sake of simplicity, assume that all the teams use the English/United States Locale in their regional settings, so the first date, 7/1/2018, is July 1 (not January 7).
When you try to work with these different formats and apply date calculations, you see that Excel does not recognize the dates in all the cells, and for some cells, it returns a #VALUE! error.
Open a copy of the workbook C02E05.xlsx. (Be sure to use a copy rather than the original workbook.)
In cell H2, add the following formula:
= G2 + 1
This formula should increment the release date by one day, but the result is 43283. This is because Excel stores dates as sequential serial numbers, so that they can be used in calculations. By default, January 1, 1900, is serial number 1, and July 1, 2018, is serial number 43282 (indicating the number of days since 1/1/1900).
To view the dates correctly, change the format of column H to Date. After you make this change, copy and paste the formula from step 2 into the next four rows: H3, H4, H5, and H6.
Cells H4 and H6 return a #VALUE! error because Excel cannot find a way to convert them to dates or numbers to increment them by one.
It’s time to learn how Power Query can help in this scenario, so open a new workbook or launch Power BI Desktop. Because your input data is based on English (United States) regional settings, you need to ensure that you use this locale in this exercise.
In Excel: While you are still in the Power Query Editor, select File. Select Options and Settings, and then select Query Options. Under Current Workbook, select Regional Settings and then select English (United States) from the Locale drop-down.
In Power BI Desktop: Select File, Options and Settings, Options. Under Current File, select Regional Settings and then select English (United States) from the Locale drop-down.
Click OK to close the Options dialog box.
Import the workbook C02E05.xlsx into the Power Query Editor:
In Excel: On the Data tab, select Get Data, From File, From Workbook.
In Power BI Desktop: In the Get Data drop-down menu, select Excel.
Select the file C02E05.xlsx and select Import.
When the Navigator dialog box opens, select Sheet1 and then select Edit.
When the Power Query Editor opens, notice that all the date values in the Release Date column are detected correctly, as shown in Figure 2-11.
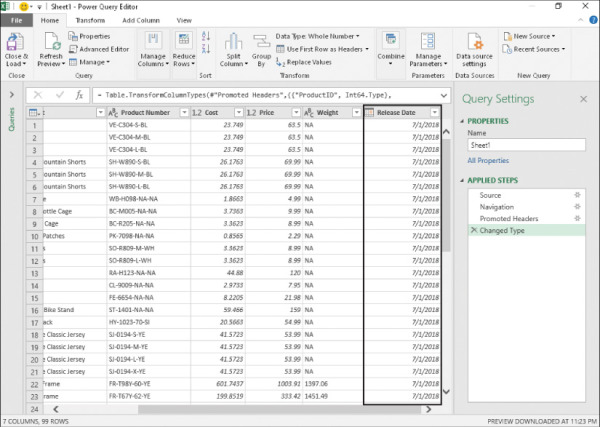
FIGURE 2-11 Power Query automatically changes the column type from Text to Date and correctly converts the different date formats.
Close the Power Query Editor and load the data to your report.
)
 TIP
TIP
If you import dates of a different locale than the one defined for your Microsoft Windows operating system, you can define the specific locale in the Query Options dialog box, as shown in step 4. After you refresh the preview in the Power Query Editor, you see that the dates are recognized correctly.
Exercise 2-6: Handling Dates with Two Locales
In Exercise 2-5, you had multiple date formats, but you assumed that all dates were used by the same locale. In this exercise, you will learn how to handle cases where your dates are for multiple locales, and the months and days values should be swapped for some of the rows.
Download the workbook C02E06.xlsx from https://aka.ms/DataPwrBIPivot/downloads and save it in C:\Data\C02. For simplicity, the workbook contains only two rows from the AdventureWorks product catalog—each row for a product with a different country and release date formatted by the specific country’s locale:
Country: United States, Release Date: 7/23/2018
Country: United Kingdom, Release Date: 23/7/2018
As you can see in Figure 2-12, the Release Date column, when changed to the Date type, returns an error value for the UK row if your locale in the Power Query Options dialog box is set to English (United States); it returns an error value for the US row if your locale is English (United Kingdom) in that dialog box.
)
FIGURE 2-12 Converting the Release Date column from Text to Date yields different errors, depending on the workbook’s or file’s locale.
To resolve this issue, you cannot rely on the locale in the Options dialog box. Instead, you can use the Split Column by Delimiter and then apply a conditional column, as described in this exercise.
Start a new blank Excel workbook or a new Power BI Desktop report.
Import C02E06.xlsx to the Power Query Editor:
In Excel: On the Data tab, select Get Data, From File, From Workbook.
In Power BI Desktop: In the Get Data drop-down menu, select Excel.
Select the file C02E06.xlsx and select Import.
In the Navigator dialog box that opens, select Products, and then select Edit.
Select the Release Date column. On the Transform tab, select Split Column and then select By Delimiter. The Split Column by Delimiter dialog box that opens detects the forward slash (/) as the delimiter. Click OK to close the dialog box.
You can now see that Release Date is split into three columns: Release Date.1, Release Date.2, and Release Date.3. When Country is UK, Release Date.1 is the day, and Release Date.2 is the month. When Country is US, Release Date.1 is the month, and Release Date.2 is the day. In the next step, you will learn how to create a new column with the correct date, using an M formula and a custom column. Then, in steps 6–10, you will learn an alternative way that doesn’t require you to know M but that involves more interactions with the user interface of the Power Query Editor.
On the Add Column tab, select Custom Column. The Custom Column dialog box opens.
Enter Date in the New Column Name box.
Enter the following formula in the Custom Column Formula box:
if [Country] = "US" then
    #date([Release Date.3], [Release Date.1], [Release Date.2])
else
    #date([Release Date.3], [Release Date.2], [Release Date.1])
Then click OK to close the dialog box.
Change the type of the Date column to Date.
Remove the columns Release Date.1, Release Date.2, and Release Date.3.
 NOTE
NOTEIn steps 6–10, you will learn the alternative way to create the date. Before you proceed, you should duplicate the current query so you can keep both versions.
To duplicate the Products query, right-click Products in the Queries pane and select Duplicate. A new query, Products (2), is created. Select it and in Applied Steps, delete the last three steps (including Added Custom).
Using the Ctrl key, select the three split date columns in this order: Release Date.1, Release Date.2, and Release Date.3. Now, on the Add Column tab, select Merge Columns. The Merge Columns dialog box opens.
Select --Custom as the separator and then enter a forward slash character (/) in the box below.
Enter US Date in the New Column Name box and click OK to close the dialog box.
Now, create a date column for the UK locale. Using the Ctrl key, select the three split date columns in this order: Release Date.2, Release Date.1, and Release Date.3. Now, on the Add Column tab, select Merge Columns. The Merge Columns dialog box opens.
Select --Custom as the separator and then enter forward slash character (/) in the box below.
Enter UK Date in the New Column Name box and click OK to close the dialog box.
You now have the columns US Date and UK Date with different date formats. It’s time to select which date format to choose for each row.
On the Add Column tab, select Conditional Column. The Add Conditional Column dialog box opens. Follow these steps to set the dialog as shown in Figure 2-13:
Enter Date in the New Column Name box.
Select Country from the Column Name drop-down.
Select Equals as the operator and enter US in the box under Value.
In the drop-down menu below Output, select Select a Column and then select US Date.
In the drop-down menu below the Otherwise label, select Select a Column and then select UK Date.
Ensure that your settings match the screenshot in Figure 2-13 and click OK to close the Add Conditional Column dialog box.
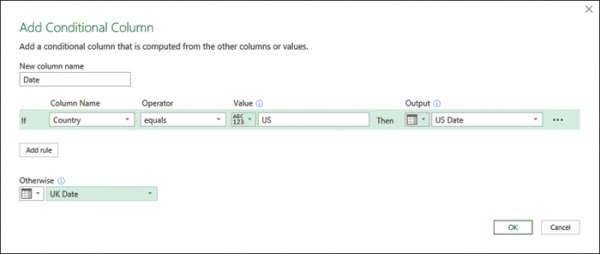
FIGURE 2-13 You can add a conditional column to select the correct date by country.
Change the type of the Date column to Date.
Remove the columns Release Date.1, Release Date.2, Release Date.3, US Date, and UK Date.
Load the query to your Excel workbook or Power BI report. The dates are displayed according to your Windows Locale settings, and you do not have any errors.
)
You can download the solution files C02E06 - Solution.xlsx and C02E06 - Solution.pbix from https://aka.ms/DataPwrBIPivot/downloads.
Extracting Date and Time Elements
Now you have Date or DateTime columns in your queries, and the format is consistent. How can you extract meaningful elements from such values? The Power Query Editor includes a wide variety of functions, as well as transformations in the Transform and Add Column tabs, to enable you to extract years, quarters, months, days, and many other calculated elements in order to enrich your dataset with time intelligence.
Here are some of the useful transformation steps, which are available on the Transform and Add Column tabs, under the Date drop-down menus when you select a Date or Date/Time column:
Age: You assign this transformation on a selected Date or Date/Time column to calculate the elapsed time since the specific date. This is implemented by subtracting the current Date/Time from the specific value.
Date Only: Extracts the date portion from the selected Date/Time column. Combined with the transformation Time Only, you can transform a Date/Time column into two separate columns, of types Date and Time, which simplifies your model and reduces the size of your report and memory consumption.
Year: Extracts the year portion from a Date or Date/Time column.
Start of Year/End of Year: Extracts the first or last day of the year as a Date value.
Month: Extracts the month portion from a Date or Date/Time column.
Start of Month/End of Month: Extracts the first or last day of the month as a Date value.
Days in Month: Calculates the number of days in the current month of the selected Date column.
Name of Month: Returns the name of the month.
Quarter of Year: Returns the quarter of the current year.
Start of Quarter/End of Quarter: Extracts the first or last day of the quarter as a Date value.
Week of Year/Week of Month: Calculates the number of the week in the year or month.
Start of Week/End of Week: Extracts the first or last day of the week as a Date value.
Day: Extracts the day portion from a Date or Date/Time column.
Start of Day/End of Day: Extracts the first or last date and time of the day from a Date/Time column.
Day of Week/Day of Year: Calculates the number of the current day in the week or year.
Name of Day: Returns the name of the day (for example, Sunday, Monday).
When you select multiple Date or Date/Time columns, you can also apply Subtract Days to calculate the elapsed time between the two dates or compute the earliest or latest dates.