Design data implementation
- By Haishi Bai, Santiago Fernandez Munoz, Dan Stolts
- 8/27/2018
Skill 2.2: Design for Azure Data Services
Information can be originated from several and distinct origins. Storing data is an important part of any workflow but not the end of the road. But once you have stored the data, you need to process, transform, present, and share it. The real value of any data is the information that it provides after you process it and share it with your clients, partners, or colleagues. Depending on the amount of information that you need to process, it can be a challenging task.
Azure Data Services provides you with the tools for managing, transform, present, and share your information efficiently while minimizing the effort and costs. Azure helps you to solve some common problems like:
Having a central repository of data sources
Orchestrating all of the operations on information transformation and presentation
Providing calculation resources for transforming data without impacting on your production environment
Storing historical information for latter analysis
Presenting and sharing the information once that it has been processed
Azure Data Catalog
Sharing information is a key point in any successful team. But sharing information is not limited only to members of a team, because sharing between teams can be even more important. When some of those teams work with data, it’s likely that they’ll work with data sources to access those information assets.
Azure Data Catalog is a service that unifies and centralizes the storage and management of data sources used in your company for accessing information assets. This service tries to address some of the most common challenging scenarios for data consumers and data producers:
A data consumer user may not have any idea about an existing data source unless it is needed as a part of another process. There is no central repository where a user can attend and review existing data sources.
A data consumer may not necessarily know the location of the data source documentation. In those cases, understanding the intended use for the data may be difficult. The documentation and the data source itself are usually stored in a variety of locations.
From the point of view of a data consumer there is no direct relationship between the information asset and those that have the expertise on the data usage.
Even if the data consumer has the data source and the documentation, she may not know the procedure for asking access to the information asset.
For a data producer, creating and maintaining the documentation for the data sources is usually a time-consuming and complex task. If the documentation is not correctly maintained, the data consumer user may start losing trust in the documentation since it can be perceived as being out of date.
Data producers may try to document data sources by using metadata associated to it, but those metadata are usually ignored by client applications.
Trying to restrict the access to data sources based on security groups can be also challenging.
Azure Data Catalog tries to address all of these challenges by providing a central store for data consumers and data creators that make data sources discoverable and understandable for those users that need to work with them. These cloud services allow you to register a data source by copying to the Data Catalog data source’s metadata and also to a reference to its location.
Once you have registered a data source into the Data Catalog, any allowed user in your company can update and enrich this registry by adding or updating tags, description or more metadata to the registered data source. You can also attach documentation and requesting procedures. When you register a new data source you need to consider two different types of metadata.
Structural metadata This is basically the information related with column names and data types extracted from the data source when you connect it to the server for the first time.
Descriptive metadata This is the metadata that you provide to the registry, like descriptions, tags, or any other metadata that helps to understand better how this data source can be used.
When provisioning a new Data Catalog, you need to bear in mind that your user needs to be a member of the Azure Active Directory associated with your subscription. You cannot use guest users for creating a new Data Catalog. Once you create your first Data Catalog, you can register for your first data source. The following procedure shows how to register your first data source using the Azure Data Catalog application:
Sign into Azure Data Catalog web site (https://www.azuredatacatalog.com).
On the Home page, select Publish Data. You can also select Publish button on the upper-right corner of the page, as shown in Figure 2-9.
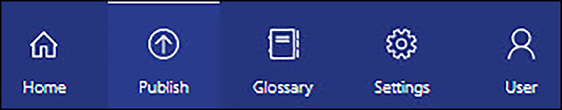
FIGURE 2-9 Data Catalog control buttons
In the Publish Your Data Now! page, click on the Launch Application button. This will download the Azure Data Catalog application that you will use for registering your first data source.
Once you install the application, you need to sign in using your Azure Active Directory account.
Next, you need to select the data source type that you want to register and click on Next. The information that you need to provide on the next page depends on the type of data source that you select. For this example, we will use Azure Blob.
For an Azure Blob data source, you need to provide the account name and the access key and click on Connect. Remember that you can get that information from the Azure portal. For the account name you don’t need to provide the suffix .core.windows.net.
On the last page, you need to select which blob or blobs you want to register on the portal.
Once you have registered all of the blobs you decided on, you can go to the Azure Data Catalog portal for reviewing your newly registered data sources.
Azure Data Factory
Working with Big Data usually involves dealing with storage, processing or transforming data, and moving data between datasources, and presenting information. The enormous amount of raw data that usually represents Big Data doesn’t have any real value until it’s processed. For this kind of workload, you need a way of automatically performing the movements between different systems that Big Data requires.
Azure Data Factory is a cloud-based service provided by Microsoft that allows you to orchestrate all of these movements between services involved on big data management and processing. Using Azure Data Factory, you can get raw data from relational data sources, like databases, line of business applications, CRMs, or ERPs, and non-relational data sources, like social media, IoT devices, web sites, or raw media. Once you get the information from the different data sources, you can move it to those services in charge of processing and transforming the information, such as Azure HDInsight, Hadoop, Spark, Azure Data Lake Analytics, and Azure Machine Learning. Figure 2-10 shows the data flow in a typical Big Data process.
)
FIGURE 2-10 Big Data process, getting data
Once you have processed and transformed the information, you can instruct Data Factory to move the information to some other service for storing and presenting the processed data. You can use, for example, Azure SQL Data Warehouse, Azure SQL Database, Azure Cosmos DB, or any other analytics engine that your users may consume for feeding their business intelligence tools.
Azure Data Factory provides the tools for automating the process of moving the information between different systems. It also provides enterprise-level monitoring tools for reviewing success and failure of the scheduled activities in Data Factory. The tools that provide monitoring features to Azure Data Factory are Azure Monitor, API, PowerShell, Microsoft Operations Manager Suite, and health panels on the Azure Portal.
Inside Azure Data Factory you use a pipeline for performing the movement of information between the different steps. A pipeline is a data-driven workflow, which is basically a group of activities that work together to perform a task. Each activity in your pipeline defines those actions you need to perform on your dataset. Based on this you can find three types of activities:
Data movement activities You use these kinds of activities for copying data between on-premises and/or cloud data stores. After you process and transform the data, you typically use these type of activities to publish your results.
Data transformation activities After copying the data to the data transformation system, you use these activities to execute the transformation in a computing environment. You can trigger activities in on-premises or cloud systems.
Control activities You use these activities for controlling the flow execution of the pipeline. As with any other type of workflow, you can also set activities dependencies to control workflow execution. Depending on the execution result of an activity, you can indicate which activity should be executed on an specific time
Another important part of any pipeline is the group of data that will be processed by the activities. That group of data is known as the dataset. You can think on the dataset as a pointer or reference to the real data on the data source that is used for each activity in the pipeline. Before any activity can use any dataset, you also need to provide the connection to the source of the data. We know that connection as a linked service. In the same way a connection string defines the properties needed by an application to connect to a database, linked services define the properties needed by Azure Data Factory for connecting to different data sources.
Azure SQL Data Warehouse
When you work on Big Data workflows, you need to perform several steps for getting the results you want to achieve. Azure Data Factory helps on automating and orchestrating the data flow between different parts. Once the data has been processed by other transformation engines, it can be moved to an Azure SQL Data Warehouse, where you will store your data into relational tables with columnar storage.
As you see in Figure 2-11, Azure SQL Data Warehouse is at the end of the chain, where the data needs to be modeled before you can present it to business intelligence applications or reporting services.
)
FIGURE 2-11 Big Data process, modeling
Thanks to the columnar storage format used in SQL Data Warehouse, queries executed in this service are several times faster than in traditional databases. This means that you can run data analysis at the massive scale that Big Data usually needs without impacting your production environments and databases.
Azure SQL Data Warehouse offers two different performance tiers. These two performance tiers allow you to choose the option that better fits your compute needs:
Optimized for Elasticity On this performance tier, storage and compute are in separate architectural layers. This tier is ideal for workloads of heavy peaks of activity, allowing you to scale the compute and storage tiers separately depending on your needs.
Optimized for Compute Microsoft provides you with the latest hardware for this performance tier, using NVMe Solid State Disk cache. This way, most recently accessed data keeps as close as possible to the CPU. This tier provides the highest level of scalability, by providing you up to 30,000 compute Data Warehouse Units (cDWU).
In order to measure the resources allocated to SQL Data Warehouse, Microsoft defines a compute scale called Data Warehouse Unit (DWUs). This unit is a bundle of CPU, memory and IOs, that provides an abstract and normalized measure of compute resources and performance. This way, if you need to assign more performance to your system, you increase the number of DWU. Although the concept is similar for both performance tiers, we use DWU for measuring resources assigned to the Optimized for Elasticity performance tier while we use cDWU for Optimized for Compute performance tier.
Thanks to compute and storage tiers separation, you can increase or decrease assignment of resources to the compute tier without affecting the pricing in the storage tier. The architecture used for providing the scale-out capabilities to Azure SQL Data Warehouse is composed by four main layers:
Azure storage This service is used for storing user data. Since multiple compute nodes need access to the data, the information is shared into distinct storage units called distributions to optimize the performance of the overall system. You can choose between three different sharing patterns, Hash, Round Robin, and Replicate, for distributing the information in the storage account. You are charged separately for Azure storage account consumption.
Control node This is the entry point to the system and the header that orchestrates and manages the whole system. The Massive Parallel Processing, or MPP, engine runs on this node, and provides the needed interfaces for interacting with different applications.
Compute nodes This layer provides the calculation power of the system. Compute nodes get the data needed for doing their job from the Distributions defined in the Azure storage layer. Each distribution maps to a compute node for its processing.
Data Movement Service This service ensures that each node in the service receives needed information when doing parallel queries for returning an accurate result.
Azure Data Lake Analytics
Following with Big Data workflows, once you gather and store your data, you need to process it. You use a processing data activity for data analysis or applying machine learning techniques that will produce new refined data that can be later modeled by other tools.
Microsoft provides Azure Data Lake Analytics for performing on-demand analytics jobs on your data sets. This service is focused on performance for managing huge amounts of information, so it’s ideal for big data workflows. Figure 2-12 shows where Azure Data Lake Analytics play its role in the workflow.
)
FIGURE 2-12 Big Data process, processing
Azure Data Lake Analytics provides you with an evolution of SQL, called U-SQL. This language extends the declarative nature of SQL with C# capabilities. This way, your developers do not need to learn a new language, just using their already acquired skills to analyze data. Thanks to integration with other Azure data services, you can take advantage of the highest performance and throughput when using Azure Storage Blobs, Azure SQL Database, or Azure SQL Data Warehouse.
Another interesting capability of Azure Data Lake Analytics is that is able to integrate with your existing IT infrastructure. This means that you can manage users and security by using your Active Directory. In the same way, Data Lake Analytics can be also integrated with Visual Studio for developing your data transform programs. The following procedure shows how to create and run a small U-SQL script.
Sign into the management portal (http://portal.azure.com).
Create a new Data Lake Analytics account. Click Create A Resource > Data + Analytics > Data Lake Analytics.
Provide needed information for creating the Data Lake Analytics account. As you can see in the Figure 2-13, you can choose between two pricing packages, Monthly commitment and Pay-as-You-Go. You need to create or select an existing Data Lake Storage account, which is covered in the Skill 2.4 section.
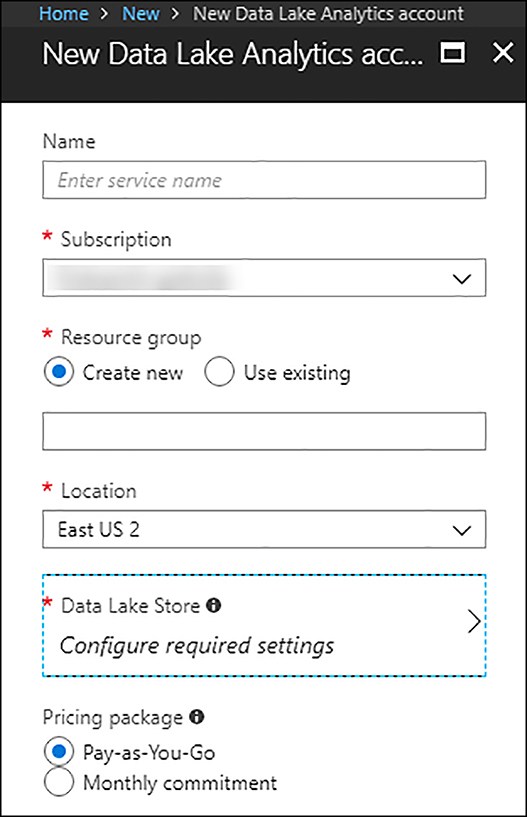
FIGURE 2-13 New Data Lake Analytics account
Once you provide all needed information, click on the Create button and wait while the account is provisioned.
Go to your newly created Data Lake Analytics account by clicking All services and typing data lake on the filter textbox. Then select Data Lake Analytics and click your new account.
We need to create a new job for running a U-SQL script. On the Overview blade of your Data Lake Analytics account, select New job located in the upper-left corner.
You need to provide a name for the new job. You will also use this blade for writing your U-SQL script. The script shown in Figure 2-14 is a very simple script for an imaginary industrial temperature measuring system that works well for our example. When running this job, you can decide to assign from 1 to 30 Analytics Units for executing the job in parallel. The more units you use, the more performance you get, and the more cost you have to pay.
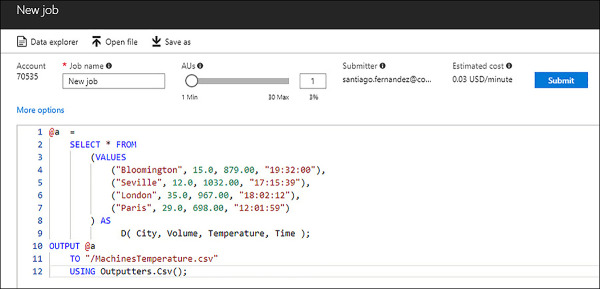
FIGURE 2-14 Creating a new job for running a U-SQL script
Once you are happy with your script, click on Submit for creating the job and submitting the script for being processed.
As soon as you submit your job, you will get the job details blade, where you can review the progress of the execution, the graph that represents the tasks performed by the script, and the output of your script. If you select the Data tab, on the Outputs tab you will see the output file created by the execution of your script.
)
)
)
Azure Analysis Services
Once you have all your data processed and modeled, you need to present it to different applications. Based on SQL Server Analysis Services, Azure Analysis Services allows you to connect distinct data sources from different origins for combining and relating the information of each source into tabular models that you can use later with Business Intelligence analysis tools, like Power BI, Excel, SQL Server Reporting Services, Tableau, or custom applications. Thanks to this, Azure Analysis Services is compatible with SQL Server Analysis Services Enterprise Edition tabular models at 1200 and 1400 compatibility models.
Azure Analysis Services integrates with Azure Active Directory, Azure Data Factory, Azure Automation and Azure Functions. These integrations provide features like role-based access control that secures the access to your data, the orchestration for feeding your models using Azure Data Fabric, or the lightweight orchestration, writing custom code using Azure Automation and Azure Functions.
You can choose between three different tiers: Developer, Basic and Standard. The processor power, Query Processing Units (QPUs), and memory size, as well as the costs, depend on the pricing tier you select. Developer and Standard tiers have the same list of features available. The difference between both tiers is the amount of resources you can assign to each tier. The Developer tier only has one instance type, while you can choose between six different instance types. For the most recent feature and instance types definition, visit the Analysis Services pricing page (https://azure.microsoft.com/en-us/pricing/details/analysis-services/).
When selecting a tier, you need to create a server for Azure Analysis Services, then select a plan or instance type within a tier. Once you select your tier, you can move your instance type up and down within the same tier. You can also move up your tier, but you cannot move down. If you select Standard tier and instance type S2, you can move to an S1 or an S4, but you cannot move to any plan on Developer or Basic tiers.
For those cases where you need to provide more power to your server, but you don’t want to increase the instance type, Azure Analysis Services provides you scale-out capabilities. When you use a single server, it is in charge of acting as the processing server and query server. If the server starts exceeding the number of assigned QPUs, because of the number of clients making queries is too high, clients will start experiencing bad performance issues. By using Azure Analysis Service’s scale-out feature, you can deploy up to seven additional instances of your server. You can create a query pool for serving client’s queries. You can have up to eight servers in your pool, which is your current server plus seven additional severs.
When you create a query pool, the processing workload is not distributed between servers in the pool. Just one server acts as the processing server. Once the processing operation is completed there is a synchronization of the processed model between all replicas in the query pool. Any single replica in the query pool only serves queries against the synced model. You can configure scale-out only for servers in the Standard tier. Each additional server in the query pool is billed at the same rate of the main server. You can configure scale-out replicas and synchronization, as well as start a manual synchronization by using Azure Portal, PowerShell, or REST API.
Between the different types of data sources that you can connect to using Azure Analysis Services, you can choose to connect to data sources located on your on-premises infrastructure. In those cases, you need to deploy and configure an on-premises data gateway. This gateway is like a bridge that provides secure transfer of your data between your on-premises data source and your Azure Analysis Services servers deployed in the cloud.
Azure HDInsight
Azure Data Lake Analytics is a good tool for processing data, but in some cases it isn’t the best option for doing the job. Different scenarios may require more specific tools for having the best results.
Azure HDInsight is a cloud native solution for deploying an optimized cluster of several Big Data open source solutions. HDInsight includes frameworks like Hadoop, Spark, Interactive Query, Kafka, Storm, HBase and R Server. The main advantage of using HDInsight is that you can select the best option to fit your specific scenario. Any of the options existing in HDInsight share some important enterprise-level features:
Cloud native When you choose any of the frameworks available in HDInsight, Azure automatically creates for you an optimized cluster for your selection. This also means that Microsoft can provide you with an SLA that ensures the level of service that you will receive.
Low-cost and scalable As with most services in cloud, you can add or remove nodes or resources to your cluster, enabling you to pay only for what you use. Using orchestration techniques with HDInsight, you can also dynamically grow or shrink your cluster based on the needs of your operation. Compute and storage resources are managed separately, which also helps to achieve performance and flexibility levels.
Secure and compliant You can also integrate HDInsight with Azure Virtual Network, encryption, and Azure Active Directory. This way you can protect your communications with the cluster and manage users’ access to the cluster using role-based access control.
Monitoring The integration of HDInsight with Azure Log Analytics enables you to have a central location for managing all of your Azure resources, including HDInsight clusters.
Extensibility HDInsight provides a full-featured cluster, but you may still need some specific features that don’t exist with any available option in HDInsight. You can easily extend HDInsight capabilities by installing additional components or integrating with third party Big Data applications.