Model the data
- By Daniil Maslyuk
- 11/5/2022
Thought experiment
In this thought experiment, demonstrate your skills and knowledge of the topics covered in this chapter. You can find the answers in the section that follows.
You are a data analyst at Contoso responsible for creating Power BI reports.
Management has requested a report based on the historical data available. Based on background information and business requirements, answer the following questions:
A data model has a fact table that has over 15 million rows. There is a date/time column called DateTime, which contains both date and time. You need to reduce the size of the data model. Your solution must preserve as much of the original data as possible. Which solution should you implement?
Change the data type of the DateTime column to Text.
Clean the DateTime column.
Split the DateTime column into two separate columns: one column that contains dates, and one column that contains the time portion.
Change the data type of the DateTime column to Date.
You create a visual that is supposed to show revenue by year. You use the Year column from the Calendar table and the Revenue measure from the Sale table. The formula of the Revenue measure is as follows:
Revenue = SUM(Sale[Total Including Tax])
The result is shown in Figure 2-31. After checking data, you can see that in 2021, revenue was $60 million. How can you fix the visual? The solution must use the minimum amount of DAX and ensure that the Calendar table can be used with other fact tables. The solution must also take into account that you may be interested in analyzing other measures based on the Sale table.
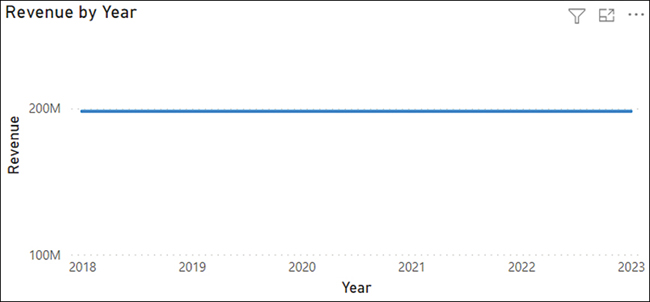
FIGURE 2.31 Revenue by Year
Use the TREATAS function in DAX.
Create an active relationship between the Calendar and the Sale tables.
Merge the Sale and Calendar tables.
Create a calculated table that calculates revenue for each year.
There are two roles in a data model: CentralRegion, which filters the Region table to only show the Central region, and AppliancesDepartment, which filters the Department table to only show the Appliances department. A user is a member of both roles. What will they see in a sales report?
Sales from the Central region or the Appliances department; they will see all departments in the Central region and all regions in the Appliances department.
Sales from the Central region and the Appliances department; they will only see the Appliances department within the Central region.
Only one role will be applied, whichever was configured first.
The user will see an error message.
Your Date table currently consists only of one column called Date, which contains dates. You need to add a column to the Date table that shows month and year in the MMMM YYYY format, e.g., May 2022. What should you do? Your solution must require the minimum amount of effort and storage, and the solution must ensure that the values are sorted chronologically.
Create a calculated column that uses the FORMAT function.
Create a calculated column that uses the EOMONTH function format as MMMM YYYY.
Duplicate the Date column and apply a custom format string.
Create a new calculated table called Date – MMMM YYYY and format as MMMM YYYY.
You need to write a measure that calculates the monthly balance. Which formula should you use?
CALCULATE(SUM(Inventory[Balance]), ENDOFMONTH('Date'[Date]))
CALCULATE(SUM(Inventory[Balance]), MAX(Inventory[Date]))
CALCULATE(SUM(Inventory[Balance]), DATESMTD(Inventory[Date]))
CALCULATE(MAX(Inventory[Balance]), LASTDATE(Inventory[Date]))
You inherit a Power BI data model that contains several tables, one of which has many calculated columns that all use the RELATED function. You would like to reduce the size of the model. What should you do?
Append tables.
Merge tables.
Separate tables into several data models.
Hide unused columns.
You created a sales report and enabled row-level security on it. There are multiple roles, each filtering the dataset to one department. Each role has a corresponding Active Directory group. The report is primarily used by sales managers, each of whom can view their department only. One sales manager has recently moved from one department to another. What should you do?
Update role membership in the Power BI service.
Change roles in Power BI Desktop.
Raise a request to remove the user from their old Active Directory group and add them to the new one.
)