Model the data
- By Daniil Maslyuk
- 11/5/2022
Skill 2.2: Develop a data model
Data model development refers to enhancements you add to your model after you’ve loaded your data and created relationships between tables. In this section, we review the skills you need to create calculated tables, calculated columns, and hierarchies, and we demonstrate how to configure row-level security for your report as well as set up the Q&A feature.
Create calculated tables
Earlier in the chapter, you saw that one way to create a calendar table is to create a calculated table, which is an alternative to using Power Query. Calculated tables are defined by using DAX, and they’re based on the data that is already loaded into the data model or new data generated by using DAX. You won’t see calculated tables in Power Query Editor.
Calculated tables are especially useful when you want to:
Clone tables, including calculated columns
Create tables that are based on data from different data sources
Precalculate measures to improve report performance
This list is not exhaustive—there are other cases when calculated tables are useful.
Cloning tables
You can use DAX to clone a table. To create a table called Invoice Date that’s a clone of the Date table, perform the following steps:
Go to the Data view.
Select New table on the Home ribbon.
Enter a calculated table expression. For example, this formula creates a table called Invoice Date by copying the Date table:
Invoice Date = 'Date'
Press Enter.
Creating tables that are based on data from different data sources
Sometimes—for example, when creating a bridge table—you may need to extract distinct values from more than one table because the distinct values may be different in different tables. In that case, you’d need to take distinct values from both tables, and if they come from different data sources or from different “islands,” or both, the performance may be slow. You can solve this issue by using a calculated table.
For example, you could retrieve the distinct Buying Group values from both the Customer and Targets tables by using the following calculated table formula:
Buying Group =
DISTINCT(
    UNION(
        DISTINCT(Customer[Buying Group]),
        DISTINCT(Targets[Buying Group])
)
The DISTINCT function ensures there are no duplicates, and UNION combines values from two tables that come from different sources. UNION acts similarly to appending tables in Power Query, though they combine tables differently:
UNION ignores column names and combines table columns based on their positions. The number of columns between tables must match.
Appending tables in Power Query combines tables based on column names, and it’s possible to combine tables that have a different number of columns.
In addition to UNION, other set functions available in DAX include EXCEPT and INTERSECT, which also require that tables have the same number of columns.
Since the data is already in memory, this process is usually much quicker compared to creating the same table by using Power Query.
Precalculating measures to improve report performance
If you have complex measures that perform poorly, depending on the type of calculation you may want to precalculate them in a calculated table, and then create new measures that aggregate the precalculated values. This approach may not work for some types of calculations, though it usually helps with additive measures.
Aggregations, which are outside the scope of the exam, are an example of calculated tables that precalculate measures and improve performance.
Create hierarchies
Power BI allows you to group columns into hierarchies, which you can then use in visuals.
In our Wide World Importers example, you can create a geographical hierarchy as follows:
Go to the Model view.
Right-click the Sales Territory column in the City table.
Select Create hierarchy.
Double-click the newly created hierarchy and rename it to Geography.
In the Fields pane, drag the State Province column on top of Geography.
Repeat the previous step for the City column.
Once created, the result should look like Figure 2-8.
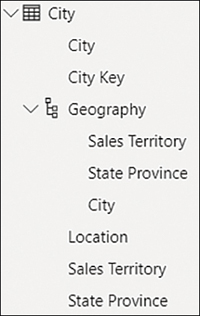
FIGURE 2-8 The Geography hierarchy
One column can be part of multiple hierarchies, and you can rename hierarchy items without affecting the original columns. At the same time, you don’t need to sort a hierarchy element by another column, because it inherits this property from the original column. The original column can be hidden, if desired.
A hierarchy can be created using only existing columns, and the columns must be in the same table. To include columns from different tables in the same hierarchy, you have to bring the columns into one table. You can do that by using Power Query or the RELATED function in DAX, for example.
Apart from the convenience of dragging multiple fields to a visual at once in the right order, a hierarchy does not provide any special benefits in Power BI compared to using columns individually, because you can use both hierarchies and multiple individual columns together in fields to achieve the same result.
Create calculated columns
Calculated columns are columns you create by using DAX. Similar to calculated tables, calculated columns can only use the data already loaded into the model or new data generated by DAX, and they don’t appear in Power Query Editor because they are generated after the data has been loaded into the model. By nature, creating calculated columns widens your table, and they are calculated after all your data is loaded, so multiple calculated columns can contribute to slow performance of your data model.
If you’re experienced in Excel, creating calculated columns in DAX may remind you of creating columns in Excel, because DAX resembles the Excel formula language, and there are many functions that appear in DAX and Excel. There are some important differences, however:
In DAX, there is no concept of a cell. If you need to get a value from a table, you have to filter a specific column down to that value.
DAX is strongly typed; it’s not possible to mix values of different data types in the same column.
In general, calculated columns are especially useful when you are:
Creating columns to be used as filters or categories in visuals
Precalculating poorly performing measures
Here’s one way to create a calculated column:
Go to the Data view.
In the Fields pane, right-click a table where you want to create a calculated column.
Select New column.
Enter a calculated column expression by using DAX.
Press Enter.
After you complete these steps, you’ll be able to see the results immediately. The formula that you write is automatically applied to each row in the new column. You can reference another column from the same table in the following way:
'Table name'[Column name]
Though it’s possible to reference a column within the same table by only using the column name, it’s not considered a good practice and should be avoided.
For example, in Wide World Importers, you can calculate total cost in a calculated column in the Sale table by using the following expression:
Total Cost = Sale[Total Excluding Tax] - Sale[Profit]
If you want to reference a column from a related table that is on the one side of a relationship, you can use the RELATED function. For instance, in Wide World Importers, you can add a calculated column to the Sale table to calculate the price difference between the standard unit price and the price a product was sold for:
Unit Price Difference = RELATED('Stock Item'[Unit Price]) - Sale[Unit Price]
RELATED works on the many side of a relationship. If you want to add a column to the one side of a relationship and reference the related rows, you can use the RELATEDTABLE function. For instance, you can add a calculated column to the Customer table to count the number of related rows in the Sale table for each customer:
Sales Rows = COUNTROWS(RELATEDTABLE(Sale))
 Exam Tip
Unless you want to use the values generated from the calculated column as filters or categories in visuals, you should be creating measures, which we cover in Skill 2.3: Create model calculations by using DAX.
Implement row-level security roles
A common business requirement is to secure data so that different users who view the same report can see different subsets of data. In Power BI, this can be accomplished with the feature called row-level security (RLS).
Row-level security restricts data by filtering it at the row level, depending on the rules defined for each user. To configure RLS, you first need to create and define each role in Power BI Desktop, and then assign individual users or Active Directory security groups to the roles in the Power BI service.
In this section, we review the skills necessary to implement row-level security roles in Power BI Desktop. We examine assignment of roles in the Power BI service in Chapter 4, “Deploy and maintain assets.”
Creating roles in Power BI Desktop
To see the list of roles configured in a dataset in Power BI Desktop, select Manage roles from the Modeling ribbon in the Report view. To create a new role, select Create in the Roles section. You’ll then be prompted to specify table filters, as shown in Figure 2-9.
)
FIGURE 2.9 Manage roles
When you create a role, you have the option to change the default name to a new one. It’s important to give roles user-friendly names because you’ll see them in Power BI service, and you need to be able to assign users to the correct roles. All roles are listed in the Roles section of the Manage roles window.
If you right-click on a role or select the ellipsis next to a role, you’ll be presented with the following options:
Create This option creates a new role and is an alternative to the Create button below the list of roles.
Duplicate This option creates a copy of the currently selected role.
Rename Use this option to rename the currently selected role; you can also rename a role by double-clicking on its name.
Delete This option deletes the currently selected role; this action can also be performed by selecting Delete below the list of roles.
For each role, you can define a DAX expression to filter each table. When row-level security is configured, these expressions will be evaluated against each row of the relevant table, and only those rows for which the expressions are evaluated as true will be visible.
You can either enter a table filter DAX expression yourself or use the ellipsis menu next to each table to add an expression that you can then customize. You can also access the menu by right-clicking on a table and choosing from these options:
Add filter This option lists all columns available in the table and lets you hide all rows.
Copy table filter from This option copies a table filter DAX expression from another role that has a filter expression defined for the table.
Clear table filter This option removes any table filter DAX expression from the table. It’s a shortcut to erasing all text from the Table filter DAX expression area manually.
For example, in the Wide World Importers data model that we previously created, you can select the ellipsis next to City > Add filter > [Sales Territory] to insert an expression, as shown in the Table filter DAX expression area:
[Sales Territory] = "Value"
The placeholder expression depends on the data type of the column, and it helps you to write the correct filter expression.
After you modify the expression, you can validate it by selecting the Verify DAX expression (check mark) button above the Table filter DAX expression area. If the expression is invalid, you’ll see a warning stating that the syntax is incorrect below the Table filter DAX expression area. Next to the check mark button is the Revert changes (cross) button, which reverts any changes that haven’t been applied yet.
To hide all rows in a table, right-click on the table and click Add filter > Hide all rows. This will add the following table filter DAX expression:
false
Because false is never going to be true for any row, no rows will be shown in this case.
You can configure row-level security in the Wide World Importers data model. First, create two roles as follows:
Create a new role and call it Southeast.
For the Southeast role, in the City table, enter the following table filter DAX expression:
[Sales Territory] = "Southeast"
Select the Verify DAX expression button above the Table filter DAX expression area.
Right-click the Southeast role and select Duplicate.
Rename the new role to Plains.
For the Plains role, update the table filter DAX expression in the City table as follows:
[Sales Territory] = "Plains"
Select Save.
We can now test the roles in Power BI Desktop.
Viewing as roles in Power BI Desktop
In Power BI Desktop, you can check what the users with specific roles will see even before you publish your report to the Power BI service and assign users to roles. For this, once you have at least one role defined, select View as on the Modeling ribbon in the Report view. You’ll then see the View as roles window shown in Figure 2-10.
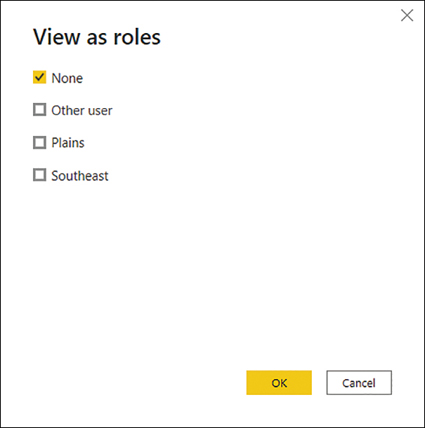
FIGURE 2-10 View as roles
Note that you can view as several roles simultaneously. This is because you can allocate a single user or a security group to multiple roles in the Power BI service; in this case, the security rules of the roles will complement each other. For example, if you select both the Plains and the Southeast roles, you’ll see data for both territories. For this reason, you should always have clear names for your RLS roles.
Exam Tip
You should know the effect of combining multiple security roles for a single user based on the description of security filters of each role.
When viewing data as roles, you’ll see the bar at the top shown in Figure 2-11.
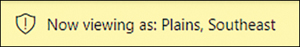
FIGURE 2-11 Now viewing report as
Another option in the View as roles window is Other user. With this option, you can test dynamic row-level security, which is covered next.
Dynamic row-level security
The roles we’ve created so far have been static, which means that all users within a role will see the same data. If you have many rules that specify how you should secure your data, this approach may mean you have to create a number of roles as well as update the data model every time a new role should be introduced or an old one removed.
There is an alternative approach, called dynamic row-level security, which allows you to show different data to different users within the same role.
For this approach, your data model must contain the usernames of people who should have access to the relevant rows of data. You’ll also need to pass the active username as a filter condition. Power BI has two functions that allow you to get the username of the current user:
USERNAME This function returns the domain and login of the user in the domain\login format.
USERPRINCIPALNAME Depending on how the Active Directory was set up, this function usually returns the email address of the user.
To see how dynamic row-level security works in our Wide World Importers data model, first create a new security role:
Select Manage roles on the Modeling ribbon.
Create a new security role and call it Dynamic RLS.
For the Dynamic RLS role, specify the following table filter DAX expression for the Employee table:
[Email] = USERPRINCIPALNAME()
Select Save.
Now you can test the new role:
Select View as on the Modeling ribbon.
Select both Other user and Dynamic RLS.
Enter jack.potter@wideworldimporters.com in the Other user box.
Select OK.
Go to the Data view.
Select the Employee table.
Note that the Employee table is now filtered to just Jack Potter’s row, as shown in Figure 2-12.
)
FIGURE 2.12 Employee table viewed as Jack Potter
Although this may be good enough for us in certain cases, it’s a common requirement for managers to see the data of those who report to them. Since Jack is a manager, he should be able to see data of the salespersons who report to him. For that, we can create a new role called Dynamic RLS (hierarchy) with the following table filter DAX expression:
PATHCONTAINS(
    PATH(
        Employee[Employee Key],
        Employee[Parent Employee Key]
    ),
    LOOKUPVALUE(
        Employee[Employee Key],
        Employee[Email],
        USERPRINCIPALNAME()
    )
)
This table filter DAX expression keeps those rows where Jack is part of the hierarchy path, which relies on the Employee table having both the ID and parent ID columns.
After you make this change, the Employee table will show four rows: Jack’s row and three rows of the salespersons who report to Jack, as seen in Figure 2-13.
)
FIGURE 2.13 Employee table viewed as Jack Potter
So far, you’ve created the roles in Power BI Desktop. Once you publish the report, you’ll have to assign users or security groups to roles in Power BI service separately. We review these skills in Chapter 4.
Use the Q&A feature
Both Power BI Desktop and the Power BI service allow you to create visualizations that provide answers to specific questions. Although this gives you great control over formatting, it won’t work if you have RLS set up and users only have read access to content.
Another way to explore data in Power BI is to use the Q&A feature, also known as natural language queries. This feature enables you to get answers to your questions by typing them in natural language. Even users with read-only access can query datasets in a natural language.
To start using Q&A in Power BI Desktop, you need to be in the Report view. To insert the Q&A visual, double-click the empty space on the report canvas. Alternatively, you can select Q&A on the Insert ribbon. Either way, you’ll see a visual, as shown in Figure 2-14.
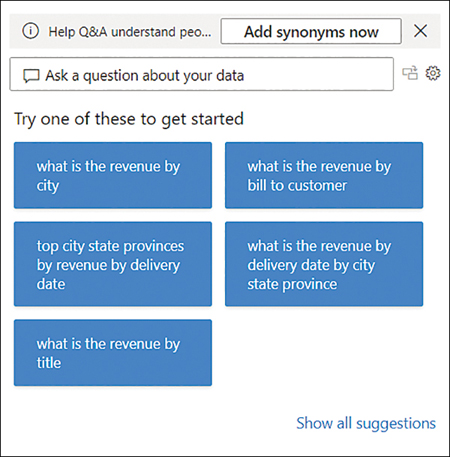
FIGURE 2-14 Q&A visual
Although the suggestions may not be immediately useful, you can ask your own questions. For example, you can enter profit by sales territory as column chart, and the result will look like Figure 2-15.
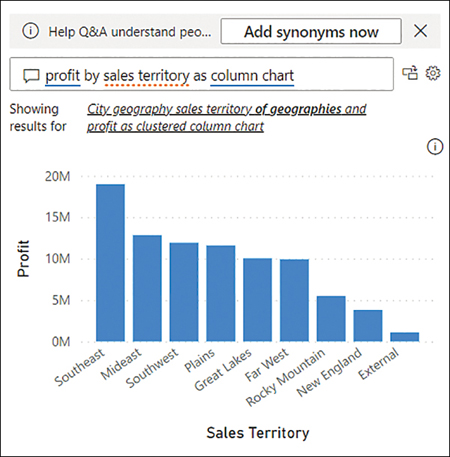
FIGURE 2-15 Q&A showing profit by sales territory
Note that the Q&A visual updates its result as you type. Before we typed “as column chart,” the Q&A visual was showing a bar chart.
If desired, you can turn the Q&A result into a standard visual by selecting the button between the question and the cog wheel in the upper-right corner of the Q&A visual.
The Q&A visual depends on the field names as they are defined in the data model. For example, entering units by sales territory in the Q&A visual won’t provide any meaningful results, as seen in Figure 2-16.
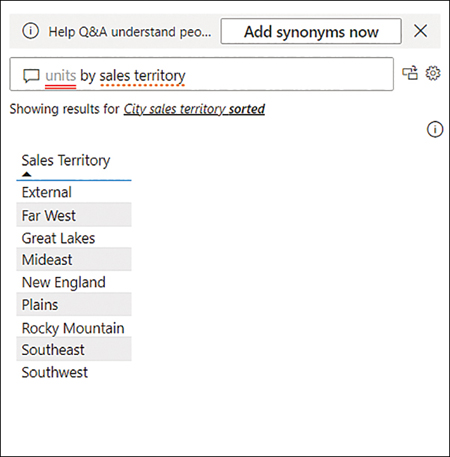
FIGURE 2-16 Q&A visual showing units by sales territory
This issue can be fixed by teaching Q&A, as outlined next.
Teach Q&A
The Q&A visual didn’t understand the term units because it doesn’t appear in the Wide World Importers data model. The Q&A visual underlines in red the terms it doesn’t understand. If you select units in the Q&A visual, you may be given suggestions to replace units with another term or to define the term. Selecting define units allows you to teach Q&A, as seen in Figure 2-17.
)
FIGURE 2.17 The Teach Q&A window
In the Define the terms Q&A didn’t understand section, you can teach Q&A that units refers to a certain field—for example, quantity—in the following way:
Enter quantity next to Unit refers to.
Select Save.
Close the Q&A setup window.
The Q&A visual now understands the term units, as you can see in Figure 2-18.
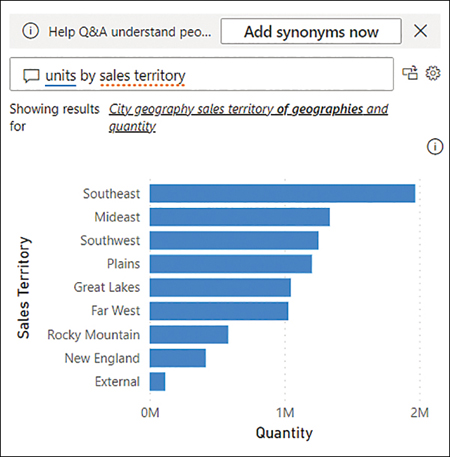
FIGURE 2-18 Q&A showing units by sales territory
Since teaching Q&A can be time-consuming, you can also add synonyms to your data model if you know them in advance, as covered next. This is another example where naming columns in Power Query Editor with friendly names will make this process easier.
Synonyms
Separately from teaching Q&A, you can introduce your own Q&A keywords and make Power BI recognize them. This is especially useful if your business users use acronyms or unique terminology such as substituting margin for profit. You can create a synonym for the Profit field, which will reduce confusion by your report users:
In the Report view, select Q&A setup on the Modeling ribbon.
Select Field synonyms on the left.
Expand the Sale section. You should see a list of fields in the Sale table, as shown in Figure 2-19.
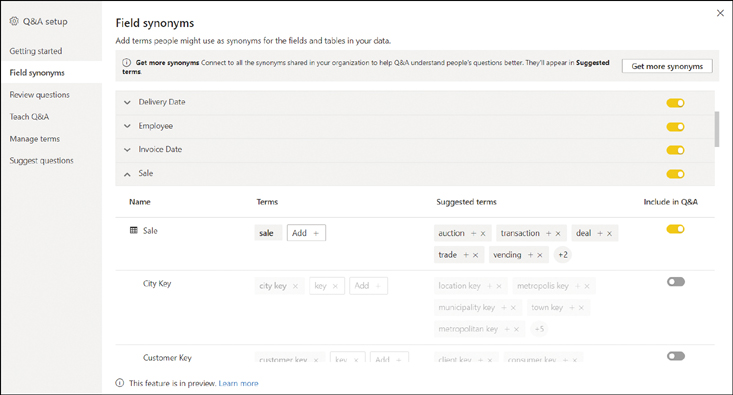
FIGURE 2.19 Field synonyms for the Sale table
Next to Profit, select Add.
Enter margin and press Enter.
Close the Q&A setup window.
)
)
)
)
)
)
)
)
If you now enter margin by color in the Q&A visual, you’ll see a bar chart showing Profit by Color, despite not using the term profit explicitly.
Additionally, in the Field synonyms section of Q&A setup, you can exclude specific tables and fields from Q&A if you don’t want Q&A to use the table or field. Hidden objects are excluded by default. This is useful if you need to include staff data in your data model but don’t want users to query this data.