Describe fundamental principles of machine learning on Azure
- By Julian Sharp
- 2/1/2022
- Skill 2.1: Identify common machine learning types
- Skill 2.2: Describe core machine learning concepts
- Skill 2.3: Identify core tasks in creating a machine learning solution
Machine learning focuses on identifying and making sense of the patterns and structures in data and using those patterns in software for reasoning and decision making. In this sample chapter from Exam Ref AI-900 Microsoft Azure AI Fundamentals, you will learn how to describe common machine learning types, identify the features and labels in a dataset, select and interpret model evaluation metrics, and more.
Machine learning (ML) is the current focus of AI in computer science. Machine learning focuses on identifying and making sense of the patterns and structures in data and using those patterns in software for reasoning and decision making. ML uses past experiences to make future predictions.
ML allows computers to consistently perform repetitive and well-defined tasks that are difficult to accomplish for humans. Over the past few years, machine learning algorithms have proved that computers can learn tasks that are tremendously complicated for machines and have demonstrated that ML can be employed in a wide range of scenarios and industries.
This chapter explains machine learning algorithms such as clustering, classification, and regression. The chapter then explains how machine learning works in terms of organizing datasets and applying algorithms to train a machine learning model. The chapter then looks at the process of building a machine learning model and the tools available in Azure.
Skill 2.1: Identify common machine learning types
Machine learning requires lots of data to build and train models to make predictions and inferences based on the relationships in data. We can use machine learning to predict a new value based on historical values and trends, to categorize a new piece of data based on data the model has already seen, and to find similarities by discovering the patterns in the data.
As humans, we can often see patterns in small datasets with a few parameters. For example, take this small set of data for students studying for this exam, as shown in Figure 2-1.
)
FIGURE 2-1 Sample data
You can probably see that there is a pattern that shows studying more hours leads to a higher exam score and passing the exam. However, can you see a pattern between the students’ academic backgrounds and whether they pass or fail, and can you answer the question of how much does completing the labs affect their score? What if you were to have more information about the student, and what if there were many more records of data? This is where machine learning can help.
Understand machine learning model types
The amount of data created by businesses, people, their devices, and applications in ordinary daily life has grown exponentially and will grow even more as sensors are embedded into machinery in factories and in our devices and our homes. This volume of data is such that we can leverage it to improve the way we make decisions and how we operate.
Microsoft runs a competition for students called the Imagine Cup (https://imaginecup.microsoft.com). In the latest competition, students were asked to design solutions using AI to tackle global problems. As a judge, I evaluated the submissions, and the breadth and creativity of the proposals were astounding. We have not yet understood all the ways that machine learning can make a difference in our lives.
When you decide that you want to use machine learning, one of the first things is to decide what type of learning you will use in your model. The type of learning determines how your model will use data to determine its outcome:
Supervised
Unsupervised
Reinforcement
Supervised learning
In supervised learning, the existing data contains the desired outcome. In machine learning, we say that the data contains a label. The labeled value is the output we want our model to determine for new data. A label can either be a value or a distinct category.
The other data that is supplied and that is used as inputs to the model are called features. A supervised learning model uses the features and label to train the model to fit the label to the features. After the model is trained, supplying the model with the features for new data will predict the value, or category, for the label.
You use supervised learning where you already have existing data that contains both the features and the label.
Unsupervised learning
In unsupervised learning, we do not have the outcome or label in the data. We use machine learning to determine the structure of the data and to look for commonalities or similarities in the data. Unsupervised learning separates the data based on the features.
You use unsupervised learning where you are trying to discover something about your data that you do not already know.
Reinforcement learning
Reinforcement learning uses feedback to improve the outcomes from the machine learning model. Reinforcement learning does not have labeled data.
Reinforcement learning uses a computer program, an agent, to determine if the outcome is optimal or not and feeds that back into the model so it can learn from itself.
Reinforcement learning is used, for example, in building a model to play chess and is commonly used in robotics.
Describe regression models
You will have probably used regression in school to draw a best fit line through a series of data points on a graph. Using the data from Figure 2-1, the hours studied are plotted against the exam scores, as shown in Figure 2-2.
)
FIGURE 2-2 Regression graph
Regression is an example of supervised machine learning where the features (in this case, the hours studied) and the label (the exam score) are known and are both used to make the model fit the features to the label.
This graph is a very simple example of linear regression with just one feature. Regression models in machine learning can have many features. There are regression algorithms other than a simple linear regression that can be used.
 Exam Tip
For this exam, you do not need to know about the different algorithms, but you must be able to differentiate between the different learning models, regression, classification, and clustering.
Regression is used to predict a numeric value using a formula that is derived from historic data. Regression predicts continuous values, not distinct categories. In Figure 2-2, the formula that has been generated is y = 9.6947x + 545.78, which implies that every hour of studying increases the exam score by almost 10 points. We can use the model and ask the question how many hours a student should study to pass the exam (Microsoft exams require a score of 700 to pass). For 16 hours of studying, our model predicts a score of 700, a pass.
However, this is where we need to start considering how our data can affect the model. If we have another result where a student has studied for 30 hours and scored 650, the regression formula changes to y = 6.7243x + 579.49, as shown in Figure 2-3.
)
FIGURE 2-3 Regression graph with additional data
With this change to our model, we now need 18 hours of studying to pass the exam. In machine learning, one of the major concerns is how data can bias our model; we will discuss bias later in this chapter.
Describe classification models
Classification machine learning models are used to predict mutually exclusive categories, or classes. Classification involves learning using labels to classify data and is an example of supervised machine learning.
Classification is used to make predictions where we do not require continuous values but need distinct categories, such as Pass or Fail.
Using the same data from Figure 2-3, we could build and train a classification model to use the hours studied to predict whether a student passes the exam or not. Using this data, a simple two-class model will likely predict that studying for less than 18 hours will fail and 18 hours or more will pass.
In a classification model, we can compare the actual labels with the prediction from the model, as shown in the table in Figure 2-4.
)
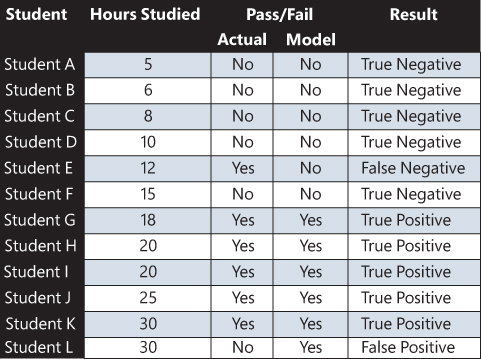
FIGURE 2-4 Classification model
We can see that the classification model correctly predicts all but two of the results. If the model predicts a pass and the actual is a pass, this is a true positive. If the model predicts a fail and the actual is a fail, this is a true negative.
In a classification model, we are interested where the model gets it wrong. For student L, the model predicts a pass, but the actual result was a fail—this is a false positive. Student E actually passed, but the model predicted that the student will fail—this is a false negative.
Describe clustering models
Clustering machine models learn by discovering similarities, patterns, and relationships in the data without the data being labeled. Clustering is an example of unsupervised learning where the model attempts to discover structure from the data or tell us something about the data that we didn’t know.
Clustering analyzes unlabeled data to find similarities in data points and groups them together into clusters. A clustering algorithm could be used, for example, to segment customers into multiple groups based on similarities in the customer’s details and history.
A clustering model predicts mutually exclusive categories, or classes. K-means clustering is a common clustering model where K is the number of distinct clusters you want the model to group the data by. The way clustering works is to calculate the distance between the data point and the center of the cluster and then to minimize the distance of each data point to the center of its cluster.
Let’s use our sample data but assume no one has taken the exam yet, so we do not have the scores or pass/fail. We have unlabeled data. Let’s see if there is a relationship between the background of the students and the hours studied. We can plot these as shown in Figure 2-5.
)
FIGURE 2-5 Clustering data
If we were to create a clustering model with K=3, then it might group the data into the three clusters—A, B, and C—as shown in Figure 2-6.
)
FIGURE 2-6 Clustering model
A common example of a clustering model is the recommender model. This is the model that was shown in Figure 1-1 for a company that wants to provide recommendations to its users by generating personalized targeted recommendations. A recommender model looks for similarities between customers. For example, a video streaming service knows which movies customers watch and can group customers by the types of movies they watch. A customer can then be shown other movies watched by other customers which are similar to them based on their viewing history.