Implement and manage threat protection
- By Ed Fisher
- 10/1/2020
- Skill 2.1: Implement an enterprise hybrid threat protection solution
- Skill 2.2: Implement device threat protection
Skill 2.2: Implement device threat protection
Endpoints include workstations, servers, laptops, and mobile devices, and they are what your users use to interact with your applications and data every day. Protecting these endpoints is critical to the overall security of your organization, and technologies to help with this include Endpoint Protection, Endpoint Detection and Response, and Threat and Vulnerability Management. In this skill, we will cover Microsoft Defender Advanced Threat Protection and how it is a key component of Microsoft Threat Protection.
Plan and implement a Microsoft Defender ATP solution
Planning and implementing Microsoft Defender ATP is straightforward. You need to be aware of the licensing requirements, the supported operating systems, and the deployment methods available to you. Microsoft Defender ATP is licensed as a part of the Microsoft 365 E5 suite and is also available with Windows Enterprise E5 (and the educational versions of those licenses). Hardware requirements are the same as for the operating systems. Remember, Microsoft Defender ATP is already a part of the Windows 10, Windows Server 2019, and Windows Server 2016 1803 operating systems. Supported operating systems at the time of this writing include:
Windows 7 SP1 Enterprise
Windows 7 SP1 Pro
Windows 8.1 Enterprise
Windows 8.1 Pro
Windows 10, version 1607 or later
Windows Server 2008 R2 SP1
Windows Server 2012 R2
Windows Server 2016
Windows Server 2016, version 1803
Windows Server 2019
macOS Mojave, macOS High Sierra, and macOS Sierra
When initially configuring Microsoft Defender ATP, you will choose the location where your data will be stored, which at the time of this writing, includes the United States, the United Kingdom, and the European Union. Once selected, you cannot change this; if you later change your mind, you must tear down and start over again. You will also choose how long data will be stored, with options from 30 to 180 days.
Deployment methods include locally run script, Group Policy Object, SCCM, and Intune, as well as other third-party MDM and software-deployment solutions, as shown in Figure 2-6.
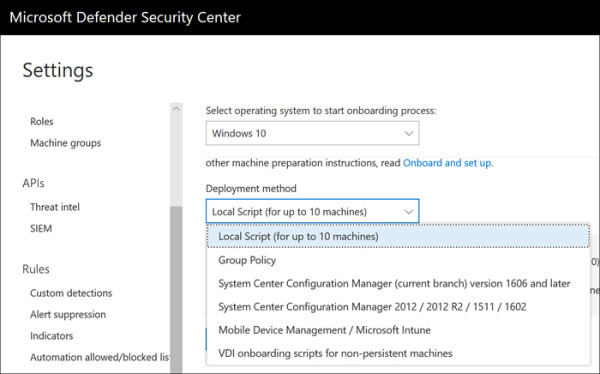
FIGURE 2.6 Microsoft Defender ATP deployment methods
For Windows 10 and Server 2019, deployment is really nothing more than pushing the configuration that specifies the Microsoft Defender ATP tenant and API key used to establish the initial connection. For older operating systems, deployment includes the installation of the Microsoft Defender ATP agent by way of an MSI file. For non-persistent VDI, note that only Windows 10 is supported.
Note that both the Windows diagnostic data service and Windows Defender Antivirus are enabled. If either of these services are disabled, Microsoft Defender ATP onboarding will fail. If you are using a third-party antivirus solution, Windows Defender Antivirus must still be enabled, though it will run in passive mode, and you will want to make sure that the Windows Defender Antivirus Early Launch Antimalware (ELAM) driver is enabled.
Manage Microsoft Defender ATP
Managing Microsoft Defender ATP is as simple as using a supported web browser and being either a Global Administrator or a Security Administrator. Additional RBAC can be configured once Microsoft Defender ATP is initially set up. You can create roles with varied capabilities and assign permissions as appropriate to your organization’s needs (see Figure 2-7).
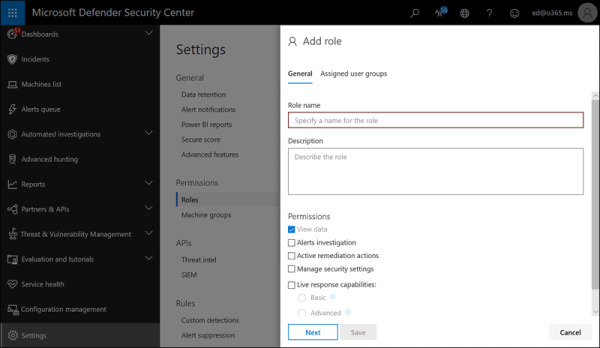
FIGURE 2.7 Adding a role in Microsoft Defender ATP
You should be familiar with each of the areas in the Microsoft Defender ATP console and what you would use each one to do.
Dashboards
Dashboards include information you would want to see first or even to keep on display in a security operations center (SOC). All offer high-level insights, and you can drill down to get more details. The dashboards include Security Operations, Secure Score, and Threat analytics.
Incidents
Anything that Microsoft Defender ATP detects is tracked as an incident. The Incidents area allows you to view and work with incidents. You can filter, classify, and assign incidents and see details. Full details are available in the Alerts associated with the incident (see Figure 2-8).
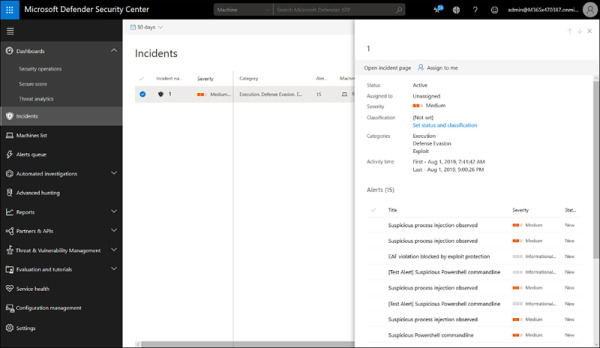
FIGURE 2.8 Incidents in Microsoft Defender ATP
Machines list
The Machines list panel displays all the enrolled machines in Microsoft Defender ATP, enables you to find or filter for a specific machine or version, and allows you to see all details of the machine, including the last logged on user; the IP address of the system; active alerts and incidents; the exposure level; security recommendations; software inventory; and discovered vulnerabilities. You can also choose Manage Tags, Collect Investigation Package, Run AntiVirus Scan, Restrict App Execution, Isolate Machine, or Action Center (see Figure 2-9).
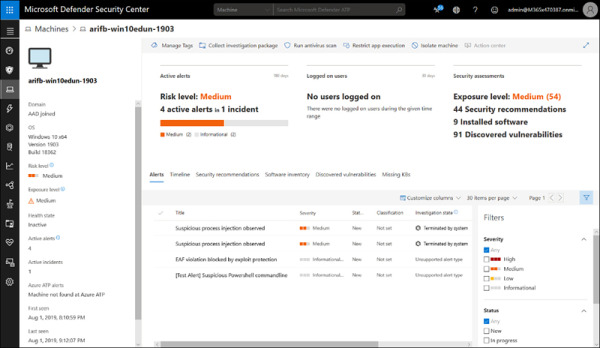
FIGURE 2.9 Viewing a machine from the Machines list
Alerts queue
The Alerts queue shows all alerts in your Microsoft Defender ATP tenant. You can sort and filter to see what alerts are associated to an incident and machine or to a user, and you can boil things down to Severity, Status, Investigation State, Category, Assigned To, Detection Source, OS Platform, and/or Associated Threat. As with most other things in the console, you can click through to get more details. Once in an alert, you can take actions, including Manage Alert, View Machine Timeline, Open Incident Page, and Print Alert, as shown in Figure 2-10.
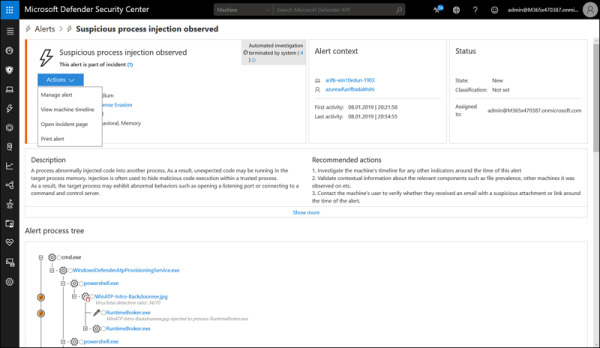
FIGURE 2.10 Viewing an alert in the Alerts queue
Automated Investigations
The Automated Investigations dashboard lists investigations automatically created by the system (see Figure 2-11). By default, it only shows you the past seven days, but you can choose an alternate time or custom date range. It lists all the automated investigations and can be filtered by Status, Triggering Alert, Detection Source, or Entity, and each investigation can be clicked to view details including the Investigation Graph, Alerts, Machines, Key Findings, Entities, Log, and Pending Actions History.
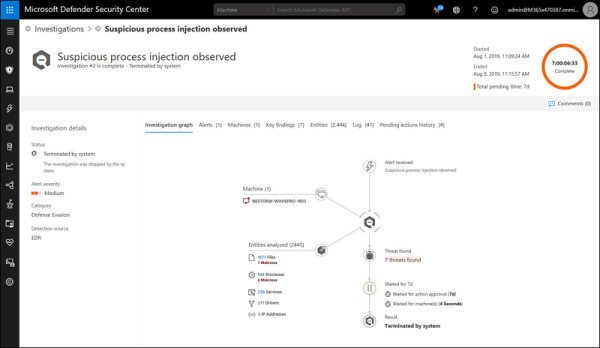
FIGURE 2.11 Viewing an Automated Investigation
Advanced Hunting
The Advanced Hunting dashboard provides an interface to create or paste queries to search data within Microsoft Defender ATP (see Figure 2-12). The Schema provides insight into what can be queried, and the Query Editor lets you create a query from scratch or paste in queries you download from GitHub or other locations. You can save and share queries for future use.
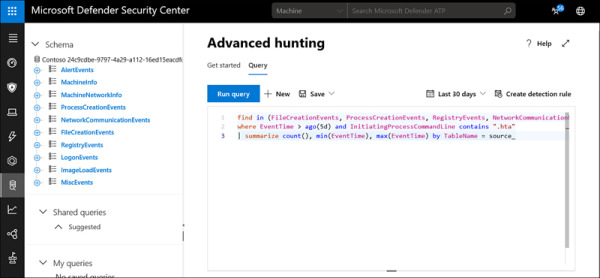
FIGURE 2.12 An Advanced Hunting query using the Kusto Query Language (KQL)
Reports
The Reports dashboard provides graphical summaries of what is going on in your environment and can be filtered like any of the other dashboards. There are two subsections under Reports. In the Threat Protection section, you can view reports on Alert Trends and an Unsolved Alert Summary that includes:
Detection Source
Category
Severity
Status
Classification And Determination
By default, reports show the past 30 days of information, but you can select other periods or custom date ranges (see Figure 2-13).
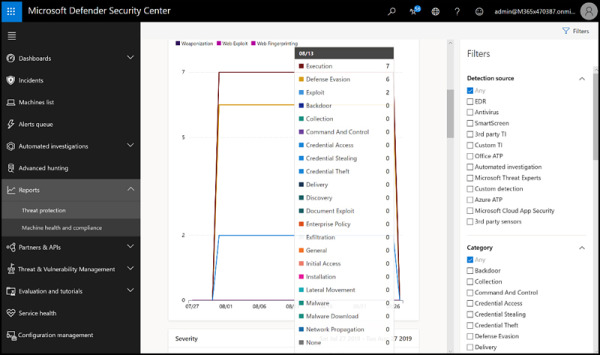
FIGURE 2.13 Viewing Threat Protection reports
In the Machine Health And Compliance subsection shown in Figure 2-14, you can view Machine Trends and Machine Summary for:
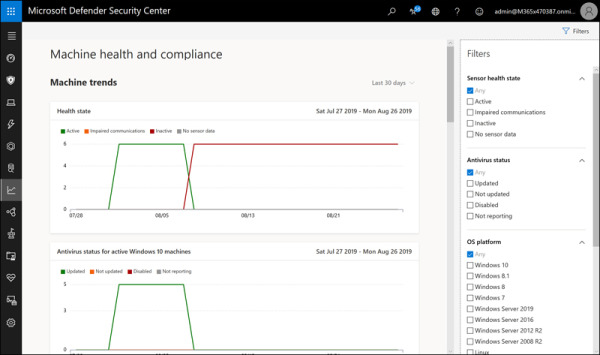
FIGURE 2.14 Viewing Machine Health And Compliance reports
Health State
Antivirus Status
OS Platform
Version
Partners & APIs
The Partners & APIs section includes two sections. The Partner Applications pane displays the many third-party applications that can be integrated with Microsoft Defender ATP. There are several, and more are added frequently. Several can be used to add capabilities for non-Microsoft operating systems, such as Mac or Linux; these include Bitdefender, SentinelOne, and Ziften, as shown in Figure 2-15.
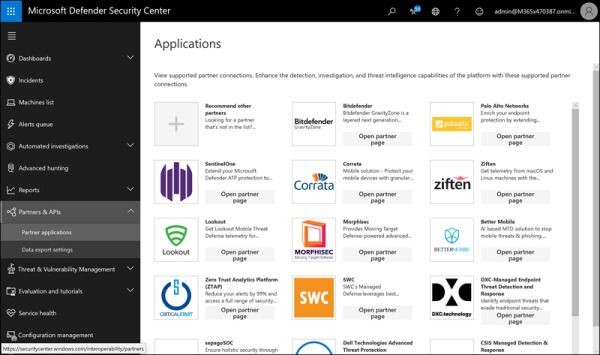
FIGURE 2.15 Viewing Partner Applications in the Partners & APIs dashboard
The Data Export Settings section is where you can choose the data export settings, which are used to push data to other applications, such as SIEMs (see Figure 2-16).
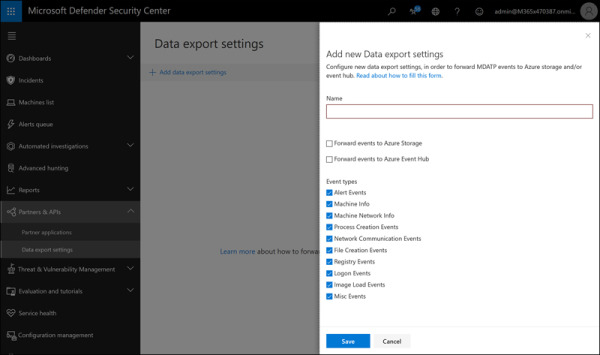
FIGURE 2.16 Add A New Data Export Settings in the Partners & APIs section
Threat & Vulnerability Management Dashboard
The Threat & Vulnerability Management Dashboard (TVM) gives administrators a risk-based, real-time way to discover vulnerabilities in their environments, prioritize them based on risk, and remediate them easily (see Figure 2-17). TVM options are Dashboard, Security Recommendations, Remediation, Software Inventory, and Weaknesses. The dashboard provides an overview, including the Exposure Distribution And Configuration Score to help administrators identify gaps and improve their security postures.
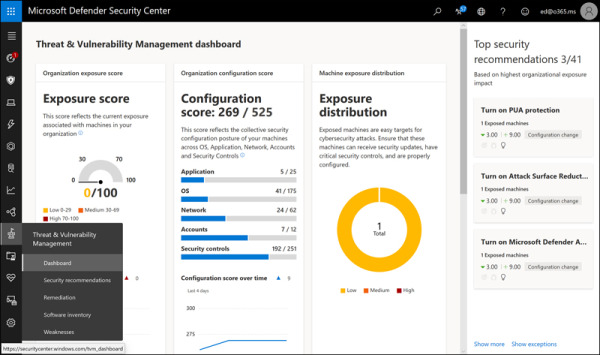
FIGURE 2.17 The Threat & Vulnerability Management Dashboard
Simulations & Tutorials
The Simulations & Tutorials section shown in Figure 2-18 includes the Evaluation Lab and a set of tutorials with simulations so that Microsoft Defender ATP administrators can work in the environment without exposing machines to actual malicious files. The Evaluation Lab lets customers try Microsoft Defender ATP using virtual machines hosted by Microsoft, while the Simulations & Tutorials section can be used against a customer’s own machines for testing and learning.
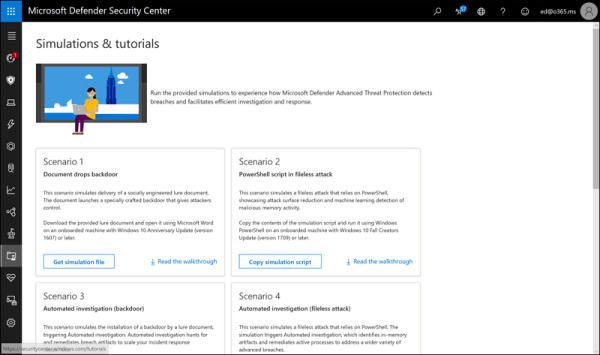
FIGURE 2.18 The Simulations & Tutorials section of Microsoft Defender ATP
Service Health
Service Health is where admins go to check on the overall health of the Microsoft Defender ATP service (see Figure 2-19). If you suspect an issue with the services provided by Microsoft, you can quickly check here to see whether there is an active incident. You can also find historical information on past issues.
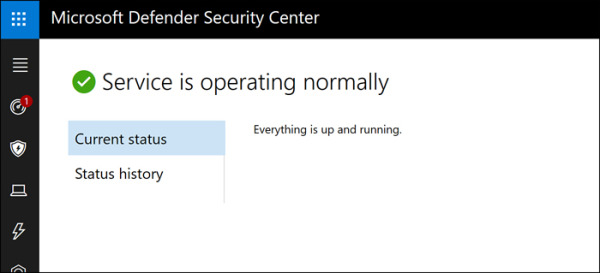
FIGURE 2.19 The Service Health dashboard
Machine Configuration Management
There is a lot included in the Machine Configuration Management dashboard shown in Figure 2-20. You can onboard machines and configure and apply security baselines to enrolled machines through Intune. Also, you can access the appropriate Intune section from here. Additionally, you can jump to the Machine Attack Surface Management section to help enable Windows settings or block possible vectors of attack. These powerful capabilities leverage Intune to apply a standard security posture to all machines.
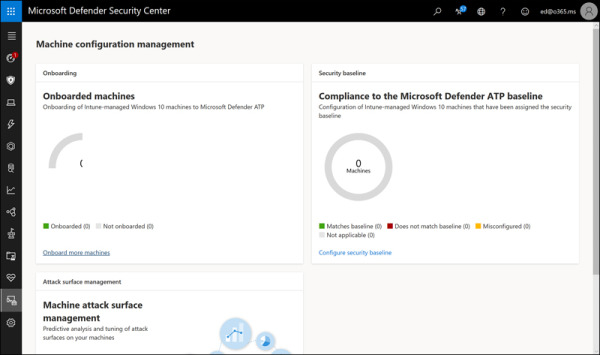
FIGURE 2.20 The Machine Configuration Management dashboard
Settings
The last section is where settings are configured. The settings are broken up into several categories, with options underneath each. They include:
General
Data Retention. This is where you determine your data is stored (US, UK, or EU) and for how long it is retained (up to 180 days).
Alert Notifications. This is where you configure email alerts.
Power BI Reports. This is where you can create PowerBI dashboards.
Secure Score. This is where you can disable those features you do not want reported on Secure Score because you are addressing the topic with third-party solutions.
Advanced Features. This is where you enable advanced features, including integration with Office ATP and Azure ATP and enabling previewing features.
Permissions
Roles. By default, Global Administrators and Security Administrators have full administrative rights in Microsoft Defender ATP, and Security Readers have read-only rights. If you require more granular control, you can enable RBAC and define roles here.
Machine Groups. If you need to manage different groups of machines in different ways (such as for testing) or if you need to delegate authority to a group you created in RBAC, you can create machine groups and assign permissions to them for management through Microsoft Defender ATP.
APIs
Threat Intel. This is being replaced with the Indicators page under Rules.
SIEM. In this section, you can enable SIEM integration with Azure Sentinel or third-party SIEMs, and you can enable MSSP capabilities to connect to your Microsoft Defender ATP instance.
Rules
Custom Detections. Custom detection rules are used to identify things that are specific to your environment. They can include Indicators of Compromise (IoCs) that you developed internally, event IDs from custom applications, or any other kind of behavior.
Alert Suppression. Suppression rules are used to mute alerts that are generated from things you just have to accept in your environment, such as a legacy app that modifies the registry each time it runs.
Indicators. Here, you can add or import file hashes, IP addresses, URLs, or domains to detect when an enrolled system attempts to access a file or a destination.
Automation Allowed/Blocked Lists. You can add code-signing certificates here for automatically blocked or allowed files.
Automation Uploads. In File Content Analysis, you can enable or disable the automatic upload of files for analysis within Microsoft Defender ATP, including specific file extensions, and you can enable or disable Memory Content Analysis. By default, both are enabled.
Automation Folder Exclusions. If you have certain proprietary applications that you do not want subject to file content analysis, you can exempt their file paths here without disabling the protection for everything else.
Machine Management
Onboarding. As discussed previously, this is where you download onboarding scripts or the installers for downstream clients.
Offboarding. As discussed previously, this is where you download offboarding scripts. Make sure you note that offboarding scripts must be refreshed every 30 days and that their file name includes the “use by” date.
Monitoring Microsoft Defender ATP
Monitoring Microsoft Defender ATP is straightforward. If your team is actively managing endpoints, then they will likely be logged into Microsoft Defender ATP and using the console throughout their work. The Security operations dashboard is designed to surface the most useful information, making it easy to determine at a glance if any actions are required. You can see the service health, at-risk machines and users, see active alerts, and determine if any machines are having sensor issues or are not reporting to the service.
You can also integrate Microsoft Defender ATP with your SIEM. Microsoft’s own SIEM—Azure Sentinel—is supported, as are both Splunk and HP ArcSight. Other SIEMs can connect using a generic connector or by using a REST API.

 EXAM TIP