Grouping, sorting, and filtering pivot data

- By Michael Alexander and Bill Jelen
- 4/7/2019
Creating hierarchies
Back in Figures 4-53 through 4-55, you used the Expand Field to drill in to different date levels. If you build your pivot table using the Data Model, you can use the Diagram View in Power Pivot to create a formal hierarchy. Once you have a hierarchy in your pivot table, you can use the Drill Down and Drill Up buttons that are perpetually grayed out in the ribbon.
Consider the pivot table and pivot chart shown in Figure 4-59. The pivot table is built using the Data Model; when you choose Insert Pivot Table, make sure to choose Add This Data To The Data Model. The pivot table has regions in the Rows area and Products in the Columns area. The pivot chart is showing a stacked column chart.
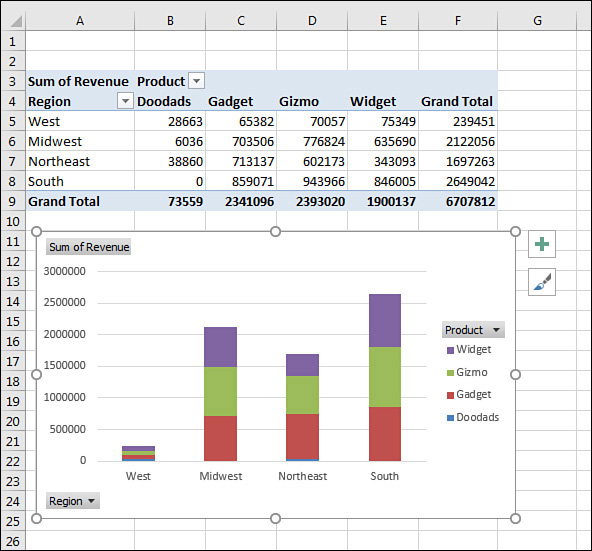
FIGURE 4-59 A pivot table and a pivot chart without any hierarchy.
Follow these steps to add a hierarchy below Region:
Click the Manage icon in the Power Pivot tab of the ribbon.
On the Home tab of the Power Pivot for Excel window, click Diagram View.
Resize the Range table so you can see all the fields.
Click on the top field for the hierarchy: Region. Ctrl+click the remaining members of the hierarchy: Market and Rep.
Right-click on Region and choose Create Hierarchy (see Figure 4-60).
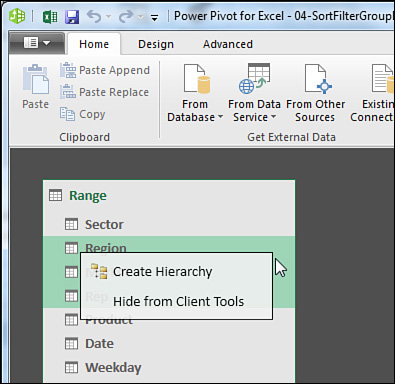
FIGURE 4-60 Select Region, Market, and Rep. Right-click and choose Create Hierarchy.
Hierarchy1 will appear at the bottom of the table. Right-click the name and choose Rename. Type a meaningful name such as Geography (see Figure 4-61).
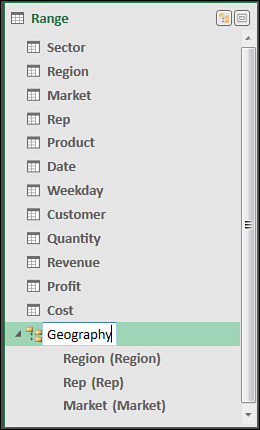
FIGURE 4-61 The hierarchy is shown at the bottom of the table.
Carefully review the sequence of the hierarchy. In Figure 4-61, Rep is appearing before Market. This is incorrect. Right-click on Market and choose Move Up.
Close the Power Pivot window and return to Excel. After a brief pause, the PivotTable Fields list will show the table name (Range), the hierarchy name (Geography), and something called More Fields.
Remove Region from the Rows area. Choose the Geography hierarchy from the PivotTable Fields list. As shown in Figure 4-62, you have something very similar to Figure 4-59. However, note that Drill Down is now enabled in the ribbon.
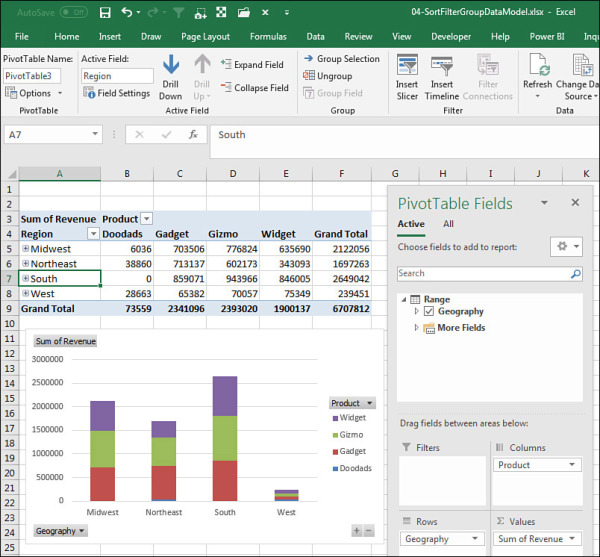
FIGURE 4-62 Plus signs appear next to each region. The Drill Down icon is enabled.
Select cell A7 for South. Click on Drill Down. The pivot table and pivot chart will change to show the markets in the South region (see Figure 4-63).
)
)
)
)
)
)
You can keep using Drill Down or Drill Up to travel through the hierarchy.
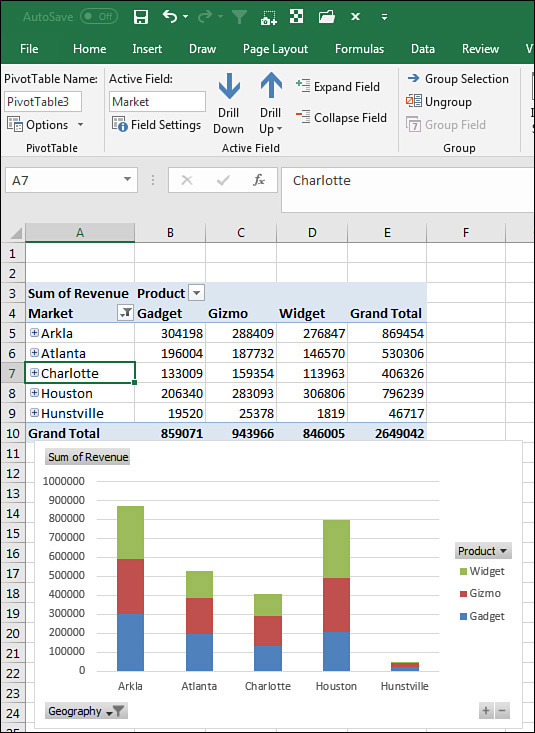
FIGURE 4-63 After drilling down on the South region, the markets in the South appear. The Drill Up icon is now enabled.