Visuals in Power BI

- By Errin O'Connor
- 4/5/2019
- Overview of visuals in Power BI
- Power BI visuals out of the box
- Third-party visuals in Power BI
- Drill through Power BI visuals
- Apply filters in Power BI reports
- Skills review
- Practice tasks
Apply filters in Power BI reports
Power BI enables you to apply filters to reports to adjust what data they contain depending on your needs. The following types of filters are available:
Visual-level filter Suppose you have a bar chart, a pie chart, and a table in your report, and you want to filter the data only in the bar chart. In that case, you’d apply a visual-level filter to that chart.
Page-level filter Maybe your report has 10 pages, but you want to apply a filter to just one of those pages. In that case you could apply a page-level filter.
Report-level filter To apply a filter to your entire report, you use a report-level filter.
Drill-through filter This filter enables you to drill through the data in a report much as you would data in a visual. For example, suppose your report contains a table. You could apply the drill-through filter to that table to analyze a piece of data in that table in depth. (See screen 1 in Figure 3-10.) To return to the table, you simply click the Back button (highlighted in screen 2 of Figure 3-10).
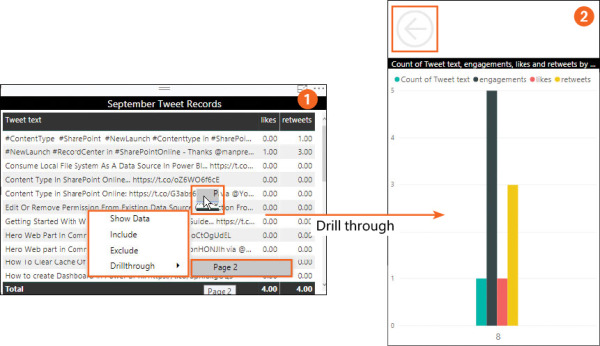
Figure 3-10 Using the drill-through filter on a table in Power BI.
)
SLICERS
A slicer is a type of visual that enables you to filter data based on different fields or properties. When you select a value in the slicer, the entire report containing the slicer is filtered based on that value. For example, consider a year-by-year analysis of school attendance. You could create a slicer visual that enables you to filter data to show only a specific year. (See image 1 in Figure 3-11.) You could configure the slicer to show the data in list mode (see image 2 in Figure 3-11) or drop-down mode (see image 3 and image 4 in Figure 3-11.) You could also adjust the orientation of the slicer to horizontal mode. (See screens 5 and 6 in Figure 3-11.)
)
Figure 3-11 Using a slicer to filter data.