Visuals in Power BI

- By Errin O'Connor
- 4/5/2019
Drill through Power BI visuals
Power BI visuals allow for the creation of attractive, eye-catching reports. This makes it much easier for users to study the data and helps reduce possible errors.
When considering data in Power BI visuals, it helps to think of it as existing in a hierarchy of sorts. This section discusses what tools you can use to drill through that hierarchy when working with Power BI visuals to gain added insights. (See Figure 3-1.)
)
Drill Down Each data point in a visualization may contain subsets of information that could provide yet more insight. For example, suppose you have a visual that shows the number of patients enrolled in various hospital programs. If you click the Drill Down option (see numeral 1 in Figure 3-9), you can gain additional information about these patients—for example, their age, their gender, and so on.
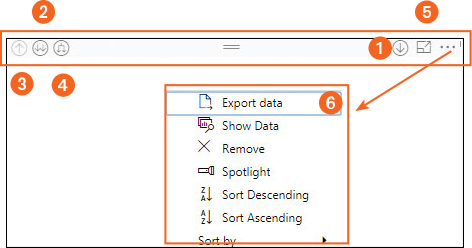
Figure 3-9 Features represented in Power BI visuals.
Expand to Next Level To drill down all fields at once by one level, click the Expand to Next Level button (see numeral 2 in Figure 3-9). This shows all available fields in the next hierarchy. For example, suppose you have a visual that contains country, state and province, and postal code data. Suppose further that the visual contains data about two countries: the US and Canada. If you click Expand to Next Level, the visual will change to show all states and provinces in the US and Canada. If you click it again, the visual will change again to show all the postal codes in each state and province.
Drill Up After you click Drill Down or Expand to Next Level, you can click Drill Up (see numeral 3 in Figure 3-9) to go back up one level.
Expand Down Click this option (see number 4 in Figure 3-9) to expand all levels at once.
 TIP
TIPTo view a visual in full-screen mode for better visibility and easier navigation, click the Focus Mode button, shown in screen 5 in Figure 3-9.
)