≡
Sign in
Your cart
Pearson

The Microsoft Press Store by Pearson

  • Topics
    • AI & Machine Learning
    • Azure
    • Certification & Training
    • Data Analytics & Excel
    • Microsoft Office
    • Windows
    • Programming
    • Software Engineering
    • All topics
  • Formats
    • Books
    • eBooks
    • Practice tests
    • Videos
  • Series
    • Best Practices - Developer
    • Best Practices - IT Pro
    • Business Skills
    • Developer Reference
    • Exam Ref
    • Inside Out
    • MOS Study Guide
    • Step by Step
    • Step by Step for Developers
    • All series
  • Authors
  • Specials
  • More
    • About
    • Contact us
    • Distribution & sales
    • Newsletter
    • Register your book
    • Sample chapters
    • Support
    • Write for us
  1. Home
  2. Sample chapters

The 5 Principles and 10 Building Blocks of Persuasive Visual Storytelling

Cliff Atkinson
  • By Cliff Atkinson
  • 11/22/2018
Contents
×
  1. Introducing the BBP Story Template
  2. The Five Principles of Visual Storytelling
  3. Principle 1: Nail Down the Story Before the Slides
  4. Principle 2: Reformat Your Information for a Yes-No Decision
  5. Principle 3: Start with No to Get to Yes
  6. Principle 4: Always Keep the End In Mind
  7. Principle 5: Think Like a Storyboard
  8. The 10 Building Blocks of a Persuasive Storyboard
  9. Building Blocks 1-4: The Hook, The Relevance, The Challenge, and The Desire
  10. Building Blocks 5-7: The Map, The Anchors, and The Explanation
  11. Building Blocks 8-10: The Headlines, The Visuals, and The Flow
  12. Sketching the First Five Slides
  13. Sketching the Remaining Slides
  14. Applying Custom Layouts
  15. Adding Graphics to the First Five Slides
  16. Adding Graphics to the Remaining Slides
  17. Stepping Into the Screen
  18. Documenting the Experience
  19. Getting Started with the BBP Story Template
  20. Writing Headlines Using Three Ground Rules
  • Back
  • Page 16 of 20
  • Next

Adding Graphics to the Remaining Slides

After you add graphics to the Act I slides, you continue by adding graphics to the rest of your slides, as shown in Figure 3-19. Here, you might use photographs, screen captures, logos, charts, and other illustrations.
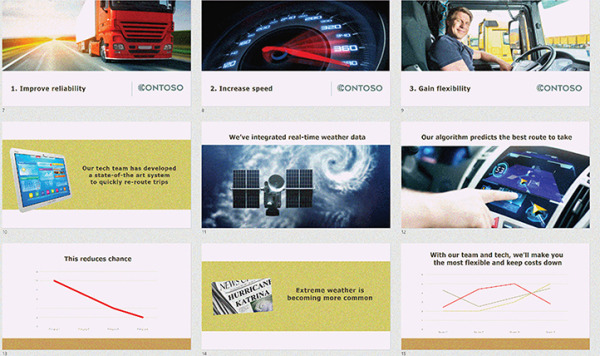
FIGURE 3-19

FIGURE 3-19 Adding graphics to the remaining slides.

Save to your account
  • Back
  • Page 16 of 20
  • Next

This chapter is from the book

Beyond Bullet Points: Using PowerPoint to tell a compelling story that gets results, 4th Edition

Beyond Bullet Points: Using PowerPoint to tell a compelling story that gets results, 4th Edition

  • Learn more Buy

Related resources

  • Titles
  • Chapters
Microsoft Excel Pivot Table Data Crunching Including Dynamic Arrays, Power Query, and Copilot

Microsoft Excel Pivot Table Data Crunching Including Dynamic Arrays, Power Query, and Copilot

  • By Bill Jelen
  • eBook $35.19
Microsoft Excel Pivot Table Data Crunching Including Dynamic Arrays, Power Query, and Copilot

Microsoft Excel Pivot Table Data Crunching Including Dynamic Arrays, Power Query, and Copilot

  • By Bill Jelen
  • Book $43.99
Exam PL-600 Microsoft Power Platform Solution Architect (Video)

Exam PL-600 Microsoft Power Platform Solution Architect (Video)

  • By Rachel Palya
  • Online video $119.99

See related titles

  • About
  • |
  • Contact us
  • |
  • Cookies
  • |
  • Privacy notice
  • |
  • Do Not Sell My Personal Information
  • |
  • Terms of use
  • © 2025 Pearson Education. All rights reserved.