The Managed Heap and Garbage Collection in the CLR

- By Jeffrey Richter
- 11/15/2012
In this chapter, I’ll discuss how managed applications construct new objects, how the managed heap controls the lifetime of these objects, and how the memory for these objects gets reclaimed. In short, I’ll explain how the garbage collector in the common language runtime (CLR) works, and I’ll explain various performance issues related to it. I’ll also discuss how to design applications so that they use memory most efficiently.
Managed Heap Basics
Every program uses resources of one sort or another, be they files, memory buffers, screen space, network connections, database resources, and so on. In fact, in an object-oriented environment, every type identifies some resource available for a program’s use. To use any of these resources requires memory to be allocated to represent the type. The following steps are required to access a resource:
-
Allocate memory for the type that represents the resource (usually accomplished by using C#’s new operator).
-
Initialize the memory to set the initial state of the resource and to make the resource usable. The type’s instance constructor is responsible for setting this initial state.
-
Use the resource by accessing the type’s members (repeating as necessary).
-
Tear down the state of a resource to clean up.
-
Free the memory. The garbage collector is solely responsible for this step.
This seemingly simple paradigm has been one of the major sources of problems for programmers that must manually manage their memory; for example, native C++ developers. Programmers responsible for managing their own memory routinely forget to free memory, which causes a memory leak. In addition, these programmers frequently use memory after having released it, causing their program to experience memory corruption resulting in bugs and security holes. Furthermore, these two bugs are worse than most others because you can’t predict the consequences or the timing of them. For other bugs, when you see your application misbehaving, you just fix the line of code that is not working.
As long as you are writing verifiably type-safe code (avoiding C#’s unsafe keyword), then it is impossible for your application to experience memory corruption. It is still possible for your application to leak memory but it is not the default behavior. Memory leaks typically occur because your application is storing objects in a collection and never removes objects when they are no longer needed.
To simplify things even more, most types that developers use quite regularly do not require Step 4 (tear down the state of the resource to clean up). And so, the managed heap, in addition to abolishing the bugs I mentioned, also provides developers with a simple programming model: allocate and initialize a resource and use it as desired. For most types, there is no need to clean up the resource and the garbage collector will free the memory.
When consuming instances of types that require special cleanup, the programming model remains as simple as I’ve just described. However, sometimes, you want to clean up a resource as soon as possible, rather than waiting for a GC to kick in. In these classes, you can call one additional method (called Dispose) in order to clean up the resource on your schedule. On the other hand, implementing a type that requires special cleanup is quite involved. I describe the details of all this in the "Working with Types Requiring Special Cleanup" section later in this chapter. Typically, types that require special cleanup are those that wrap native resources like files, sockets, or database connections.
Allocating Resources from the Managed Heap
The CLR requires that all objects be allocated from the managed heap. When a process is initialized, the CLR allocates a region of address space for the managed heap. The CLR also maintains a pointer, which I’ll call NextObjPtr. This pointer indicates where the next object is to be allocated within the heap. Initially, NextObjPtr is set to the base address of the address space region.
As the region fills with non-garbage objects, the CLR allocates more regions and continues to do this until the whole process’s address space is full. So, your application’s memory is limited by the process’s virtual address space. In a 32-bit process, you can allocate close to 1.5 gigabytes (GB) and in a 64-bit process, you can allocate close to 8 terabytes.
C#’s new operator causes the CLR to perform the following steps:
-
Calculate the number of bytes required for the type’s fields (and all the fields it inherits from its base types).
-
Add the bytes required for an object’s overhead. Each object has two overhead fields: a type object pointer and a sync block index. For a 32-bit application, each of these fields requires 32 bits, adding 8 bytes to each object. For a 64-bit application, each field is 64 bits, adding 16 bytes to each object.
-
The CLR then checks that the bytes required to allocate the object are available in the region. If there is enough free space in the managed heap, the object will fit, starting at the address pointed to by NextObjPtr, and these bytes are zeroed out. The type’s constructor is called (passing NextObjPtr for the this parameter), and the new operator returns a reference to the object. Just before the reference is returned, NextObjPtr is advanced past the object and now points to the address where the next object will be placed in the heap.
Figure 21-1 shows a managed heap consisting of three objects: A, B, and C. If another object were to be allocated, it would be placed where NextObjPtr points to (immediately after object C).
)
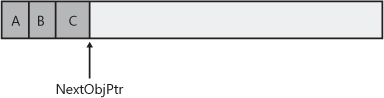
Figure 21-1 Newly initialized managed heap with three objects constructed in it.
For the managed heap, allocating an object simply means adding a value to a pointer—this is blazingly fast. In many applications, objects allocated around the same time tend to have strong relationships to each other and are frequently accessed around the same time. For example, it’s very common to allocate a FileStream object immediately before a BinaryWriter object is created. Then the application would use the BinaryWriter object, which internally uses the FileStream object. Because the managed heap allocates these objects next to each other in memory, you get excellent performance when accessing these objects due to locality of reference. Specifically, this means that your process’s working set is small, which means your application runs fast with less memory. It’s also likely that the objects your code is accessing can all reside in the CPU’s cache. The result is that your application will access these objects with phenomenal speed because the CPU will be able to perform most of its manipulations without having cache misses that would force slower access to RAM.
So far, it sounds like the managed heap provides excellent performance characteristics. However, what I have just described is assuming that memory is infinite and that the CLR can always allocate new objects at the end. However, memory is not infinite and so the CLR employs a technique known as garbage collection (GC) to “delete” objects in the heap that your application no longer requires access to.
The Garbage Collection Algorithm
When an application calls the new operator to create an object, there might not be enough address space left in the region to allocate the object. If insufficient space exists, then the CLR performs a GC.
For managing the lifetime of objects, some systems use a reference counting algorithm. In fact, Microsoft’s own Component Object Model (COM) uses reference counting. With a reference counting system, each object on the heap maintains an internal field indicating how many “parts” of the program are currently using that object. As each “part” gets to a place in the code where it no longer requires access to an object, it decrements that object’s count field. When the count field reaches 0, the object deletes itself from memory. The big problem with many reference counting systems is that they do not handle circular references well. For example, in a GUI application, a window will hold a reference to a child UI element. And the child UI element will hold a reference to its parent window. These references prevent the two objects’ counters from reaching 0, so both objects will never be deleted even if the application itself no longer has a need for the window.
Due to this problem with reference counting garbage collector algorithms, the CLR uses a referencing tracking algorithm instead. The reference tracking algorithm cares only about reference type variables, because only these variables can refer to an object on the heap; value type variables contain the value type instance directly. Reference type variables can be used in many contexts: static and instance fields within a class or a method’s arguments or local variables. We refer to all reference type variables as roots.
When the CLR starts a GC, the CLR first suspends all threads in the process. This prevents threads from accessing objects and changing their state while the CLR examines them. Then, the CLR performs what is called the marking phase of the GC. First, it walks through all the objects in the heap setting a bit (contained in the sync block index field) to 0. This indicates that all objects should be deleted. Then, the CLR looks at all active roots to see which objects they refer to. This is what makes the CLR’s GC a reference tracking GC. If a root contains null, the CLR ignores the root and moves on to examine the next root.
Any root referring to an object on the heap causes the CLR to mark that object. Marking an object means that the CLR sets the bit in the object’s sync block index to 1. When an object is marked, the CLR examines the roots inside that object and marks the objects they refer to. If the CLR is about to mark an already-marked object, then it does not examine the object’s fields again. This prevents an infinite loop from occurring in the case where you have a circular reference.
Figure 21-2 shows a heap containing several objects. In this example, the application roots refer directly to objects A, C, D, and F. All of these objects are marked. When marking object D, the garbage collector notices that this object contains a field that refers to object H, causing object H to be marked as well. The marking phase continues until all the application roots have been examined.
)
Once complete, the heap contains some marked and some unmarked objects. The marked objects must survive the collection because there is at least one root that refers to the object; we say that the object is reachable because application code can reach (or access) the object by way of the variable that still refers to it. Unmarked objects are unreachable because there is no root existing in the application that would allow for the object to ever be accessed again.
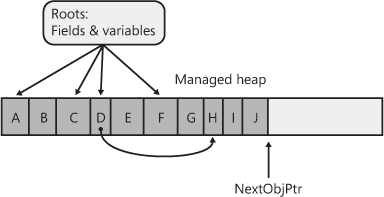
Figure 21-2 Managed heap before a collection.
Now that the CLR knows which objects must survive and which objects can be deleted, it begins the GC’s compacting phase. During the compacting phase, the CLR shifts the memory consumed by the marked objects down in the heap, compacting all the surviving objects together so that they are contiguous in memory. This serves many benefits. First, all the surviving objects will be next to each other in memory; this restores locality of reference reducing your application’s working set size, thereby improving the performance of accessing these objects in the future. Second, the free space is all contiguous as well, so this region of address space can be freed, allowing other things to use it. Finally, compaction means that there are no address space fragmentation issues with the managed heap as is known to happen with native heaps.1
When compacting memory, the CLR is moving objects around in memory. This is a problem because any root that referred to a surviving object now refers to where that object was in memory; not where the object has been relocated to. When the application’s threads eventually get resumed, they would access the old memory locations and corrupt memory. Clearly, this can’t be allowed and so, as part of the compacting phase, the CLR subtracts from each root the number of bytes that the object it referred to was shifted down in memory. This ensures that every root refers to the same object it did before; it’s just that the object is at a different location in memory.
After the heap memory is compacted, the managed heap’s NextObjPtr pointer is set to point to a location just after the last surviving object. This is where the next allocated object will be placed in memory. Figure 21-3 shows the managed heap after the compaction phase. After the compaction phase is complete, the CLR resumes all the application’s threads and they continue to access the objects as if the GC never happened at all.
)
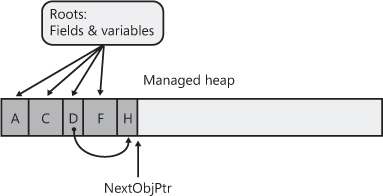
Figure 21-3 Managed heap after a collection.
If the CLR is unable to reclaim any memory after a GC and if there is no address space left in the processes to allocate a new GC segment, then there is just no more memory available for this process. In this case, the new operator that attempted to allocate more memory ends up throwing an OutOfMemoryException. Your application can catch this and recover from it but most applications do not attempt to do so; instead, the exception becomes an unhandled exception, Windows terminates the process, and then Windows reclaims all the memory that the process was using.
As a programmer, notice how the two bugs described at the beginning of this chapter no longer exist. First, it’s not possible to leak objects because any object not accessible from your application’s roots will be collected at some point. Second, it’s not possible to corrupt memory by accessing an object that was freed because references can only refer to living objects, because this is what keeps the objects alive anyway.
Garbage Collections and Debugging
As soon as a root goes out of scope, the object it refers to is unreachable and subject to having its memory reclaimed by a GC; objects aren’t guaranteed to live throughout a method’s lifetime. This can have an interesting impact on your application. For example, examine the following code.
using System;
using System.Threading;

public static class Program {
   public static void Main() {
       // Create a Timer object that knows to call our TimerCallback
       // method once every 2000 milliseconds.
       Timer t = new Timer(TimerCallback, null, 0, 2000);

       // Wait for the user to hit <Enter>.
       Console.ReadLine();
   }

   private static void TimerCallback(Object o) {
      // Display the date/time when this method got called. Console.WriteLine("In TimerCallback: " + DateTime.Now);

      // Force a garbage collection to occur for this demo. GC.Collect();
   }
}
Compile this code from the command prompt without using any special compiler switches. When you run the resulting executable file, you’ll see that the TimerCallback method is called just once!
From examining the preceding code, you’d think that the TimerCallback method would get called once every 2,000 milliseconds. After all, a Timer object is created, and the variable t refers to this object. As long as the timer object exists, the timer should keep firing. But you’ll notice in the TimerCallback method that I force a garbage collection to occur by calling GC.Collect().
When the collection starts, it first assumes that all objects in the heap are unreachable (garbage); this includes the Timer object. Then, the collector examines the application’s roots and sees that Main doesn’t use the t variable after the initial assignment to it. Therefore, the application has no variable referring to the Timer object, and the garbage collection reclaims the memory for it; this stops the timer and explains why the TimerCallback method is called just once.
Let’s say that you’re using a debugger to step through Main, and a garbage collection just happens to occur just after t is assigned the address of the new Timer object. Then, let’s say that you try to view the object that t refers to by using the debugger’s Quick Watch window. What do you think will happen? The debugger can’t show you the object because it was just garbage collected. This behavior would be considered very unexpected and undesirable by most developers, so Microsoft has come up with a solution.
When you compile your assembly by using the C# compiler’s /debug switch, the compiler applies a System.Diagnostics.DebuggableAttribute with its DebuggingModes’ DisableOptimizations flag set into the resulting assembly. At run time, when compiling a method, the JIT compiler sees this flag set, and artificially extends the lifetime of all roots to the end of the method. For my example, the JIT compiler tricks itself into believing that the t variable in Main must live until the end of the method. So, if a garbage collection were to occur, the garbage collector now thinks that t is still a root and that the Timer object that t refers to will continue to be reachable. The Timer object will survive the collection, and the TimerCallback method will get called repeatedly until Console.ReadLine returns and Main exits.
To see this, just recompile the program from a command prompt, but this time, specify the C# compiler’s /debug switch. When you run the resulting executable file, you’ll now see that the TimerCallback method is called repeatedly! Note, the C# compiler’s /optimize+ compiler switch turns optimizations back on, so this compiler switch should not be specified when performing this experiment.
The JIT compiler does this to help you with JIT debugging. You may now start your application normally (without a debugger), and if the method is called, the JIT compiler will artificially extend the lifetime of the variables to the end of the method. Later, if you decide to attach a debugger to the process, you can put a breakpoint in a previously compiled method and examine the root variables.
So now you know how to build a program that works in a debug build but doesn’t work correctly when you make a release build! Because no developer wants a program that works only when debugging it, there should be something we can do to the program so that it works all of the time regardless of the type of build.
You could try modifying the Main method to the following.
public static void Main() {
    // Create a Timer object that knows to call our TimerCallback
    // method once every 2000 milliseconds.
    Timer t = new Timer(TimerCallback, null, 0, 2000);

    // Wait for the user to hit <Enter>.
    Console.ReadLine();

    // Refer to t after ReadLine (this gets optimized away)
    t = null;
}
However, if you compile this (without the /debug+ switch) and run the resulting executable file, you’ll see that the TimerCallback method is still called just once. The problem here is that the JIT compiler is an optimizing compiler, and setting a local variable or parameter variable to null is the same as not referencing the variable at all. In other words, the JIT compiler optimizes the t = null; line out of the code completely, and therefore, the program still does not work as we desire. The correct way to modify the Main method is as follows.
public static void Main() {
    // Create a Timer object that knows to call our TimerCallback
    // method once every 2000 milliseconds.
    Timer t = new Timer(TimerCallback, null, 0, 2000);

    // Wait for the user to hit <Enter>.
    Console.ReadLine();

    // Refer to t after ReadLine (t will survive GCs until Dispose returns)
    t.Dispose();
}
Now, if you compile this code (without the /debug+ switch) and run the resulting executable file, you’ll see that the TimerCallback method is called multiple times, and the program is fixed. What’s happening here is that the object t is required to stay alive so that the Dispose instance method can be called on it. (The value in t needs to be passed as the this argument to Dispose.) It’s ironic: by explicitly indicating where you want the timer to be disposed, it must remain alive up to that point.