Introduction to Azure Security Center
- By Yuri Diogenes and Tom Janetscheck
- 5/30/2021
- Deployment scenarios
- Understanding Security Center
- Planning adoption
- Onboarding resources
- Inventory
Understanding Security Center
Because Security Center is an Azure service, you must have an Azure subscription to use it—even if it’s just a trial subscription.
With an Azure subscription, you can activate the free tier of Security Center. This free tier monitors compute, network, storage, and application resources in Azure. It also provides security policy, security assessment, security recommendations, and the ability to connect with other security partner solutions. Organizations that are getting started with Infrastructure as a Service (IaaS) in Azure can benefit even from this free service because it will improve their security postures.
In addition to the free tier, Security Center offers an option to upgrade to Azure Defender. This option offers a complete set of security capabilities for organizations that need more control and threat detection. Specifically, migrating your Security Center subscription from the free tier to Azure Defender enable the following features:
Security event collection and advanced search
Network Map
Just-in-time VM Access
Adaptive application controls
Regulatory compliance reports
File integrity monitoring
Network Security Group (NSG) hardening
Security alerts
Threat protection for Azure VMs, non-Azure VMs, and PaaS services
Integration with Microsoft Defender for Endpoint (MSDE)
Multi-cloud support for Amazon Web Services (AWS) and Google Cloud Platform (GCP)
Vulnerability assessment integration with Qualys
Another advantage of upgrading to Azure Defender is that it enables you to monitor on-premises resources and VMs hosted by other cloud providers. You achieve this by onboarding your machine using Azure Arc and then installing the Log Analytics agent in the target machine. (This is covered in more detail later in this chapter.)
When you upgrade to Azure Defender, you can use it free for 30 days. This is a good opportunity to evaluate these features, see how your current environment will benefit from them, and decide whether they’re worth the investment. For the latest information about Azure Security Center pricing, visit http://aka.ms/ascpricing.
Security Center architecture
To better understand how Security Center communicates with different resources, it is important to understand its core architecture. Figure 2-1 shows the core Security Center features and how they interact with external components.
)
FIGURE 2-1 Connectivity between Security Center and other services
In Figure 2-1, if you look at the core diagram, which represents Security Center, you will see three major boxes: Recommendations, Alerts, and Continuous Export. The recommendations are an important component of the CSPM scenario because it is via the remediation of recommendations that you will enhance your security posture. Alerts contains the security alerts that are triggered when suspicious activities are identified. Alerts are based on a variety of threat detections, which are enabled when you upgrade to Azure Defender. Recommendations and alerts can be streamed to the Log Analytics workspace of your choice using the Continuous Export feature, and they can also be streamed to an Event Hub to be consumed by a third-party security information and event management (SIEM) system.
Recommendations can also be received based on the connectivity with other cloud providers such as AWS and GCP, which you will learn how to onboard later in this chapter. Another form of ingesting external recommendations is via third-party partners, which usually will be sending those recommendations via Application Program Interface (API). By the time this third edition was written, the partners available were Tenable, Cyberark, and Checkpoint.
Security Center uses the Log Analytics Agent, which is configured to send information to a particular Log Analytics workspace. Regardless of the VM location (in Azure or not), the agent must always be installed to enable Security Center to have more visibility about the machine’s security events. In Windows systems, Security Center installs the Log Analytics Agent, and in Linux systems, besides the agent for Linux, Security Center also creates the omsagent daemon, which runs under the omsagent account. This account is automatically created during agent installation.
In Linux systems, Security Center collects audit records from Linux machines using the auditd framework (it doesn’t require the auditd daemon to be running). The auditd system consists of two major components:
First is a set of user-space utilities offering a wide collection of operations allowing administrators to better adjust rules, analyze audit log files, or troubleshoot if things are misconfigured.
Second is a kernel-level subsystem that is responsible for monitoring system calls, filtering them by given rule set, and writing match messages to a buffer.
Both components are communicating through a netlink socket. Auditd records are collected, aggregated into events, and enriched using the latest version of the Log Analytics Agent for Linux.
In Windows systems, Log Analytics Agent scans for various security-related configurations and events in Event Tracing for Windows (ETW) traces. In addition, this agent collects the following:
Operating system logs, such as Windows events
Operating system type and version
Running processes
Machine name
IP addresses
Logged in user (username)
Tenant ID
User mode crash dump created by Windows Error Reporting (WER)
This information is sent to your workspace, which is an Azure resource used as a container to store your data. A workspace provides a geographic location for data storage, granularity for billing, and data isolation, and it helps you to better scope the configuration.
If you are using Azure Log Analytics and you already have a workspace, this workspace can be used by Security Center to store data coming from the agent. If you are not using Azure Log Analytics, a new workspace will be automatically created when you start using Security Center. The location of the workspace created by Security Center is based on the geolocation of the VM.
If you are a global company and you need to store data in specific regions for data sovereignty or compliance reasons, you might consider creating multiple workspaces. Another scenario that might call for multiple workspaces is if you want to isolate various users. For example, you might want each customer, department, or business group to see their own data but not the data for others.
Once you upgrade from Security Center Free to Azure Defender, you will also have threat detection enabled for different workloads. Figure 2-2 shows how Azure Defender uses the information collected from VMs to generate a VM-based alert. In this example, non-Azure machines and Azure VMs send data collected by the agent to the workspace. Azure Defender uses this data for advanced threat detection analysis and generates recommendations that fit within the prevention module or issues alerts that are part of the detection module. Azure Defender employs advanced security analytics—a method that is far more powerful than the traditional signature-based approach.
)
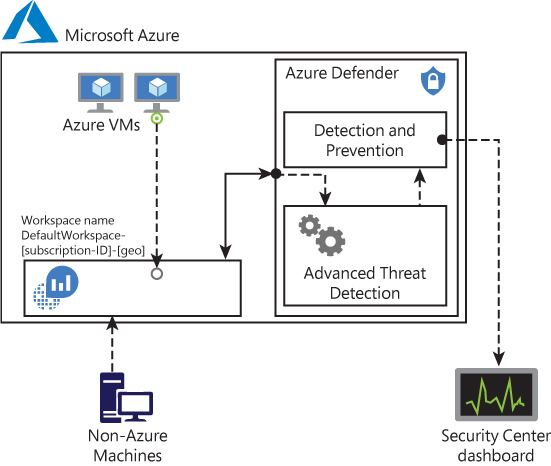
FIGURE 2-2 Azure Defender threat detection
One scenario in which multiple workspaces are needed is when you need to isolate data, such as if a company wants a separate workspace for each branch office, as shown in Figure 2-3.
)
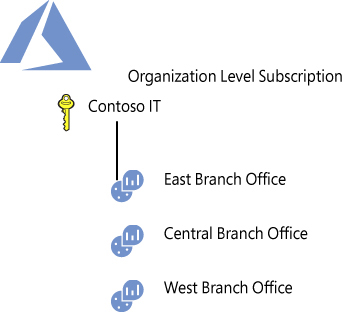
FIGURE 2-3 Workspace organization based on geolocation
Once the data is in the workspace, Azure Defender uses machine-learning technologies to evaluate all relevant events across the entire cloud fabric. By using this approach, it is possible to quickly identify threats that would be extremely hard to identify using manual processes. Azure Defender uses the following analytics:
Integrated threat intelligence This leverages global threat intelligence from Microsoft to look for known bad actors.
Behavioral analytics This looks for known patterns and malicious behaviors—for example, a process executed in a suspicious manner, hidden malware, an exploitation attempt, or the execution of a malicious PowerShell script.
Anomaly detection This uses statistical profiling to build a historical baseline and triggers an alert based on deviations from this baseline. An example of this would be a VM that normally receives remote desktop connections 5 times a day but suddenly receives 100 connection attempts. This deviation would trigger an alert.
Security Center dashboard
To access the Security Center dashboard, sign in to Azure portal (https://portal.azure.com) and click Security Center in the left pane. What happens the first time you open the Security Center dashboard may vary. For the purposes of this example, the dashboard is fully populated with resources, recommendations, and alerts, as shown in Figure 2-4.
)
FIGURE 2-4 Security Center dashboard
As you can see in Figure 2-4, the Security Center Overview dashboard has four major areas: Secure Score, Regulatory Compliance, Azure Defender and Firewall Manager. This breakdown provides a quick overview of the main areas in Security Center. There are more options available in the left navigation pane. These options are organized in the following categories:
General In this area, you will find options that can be used by your daily cloud security posture management activities, such as recommendations and inventory. It also can be used to onboard non-Azure machines and search for alerts.
Cloud Security The options that are here will be used to manage your Secure Score, regulatory compliance, and to access Azure Defender features.
Management The options that are here will be used to govern Security Center, including policies, workflow automation, and many others.
Throughout this book, all these options will be covered. However, for now, just browse each one of these options to familiarize yourself with the interface.