Using Security Center for incident response
- By Yuri Diogenes and Tom Shinder
- 8/23/2018
- Understanding security alerts
- Detection scenarios
- Accessing security alerts
- Investigating a security issue
- Responding to a security alert
Accessing security alerts
The number of security alerts you see in the Security Center dashboard may vary depending on the amount of resources that you are monitoring with Security Center and the business itself. Some organizations receive more attacks than others, and as a result have more security alerts.
If you don’t have any security alerts in your environment, simulate one by following the procedures in the following article: https://aka.ms/ASCAlertValidation. Once you have an alert, follow these steps to access it:
Open the Azure Portal and sign in as a user who has Security Admin privileges.
In the left pane, click Security Center.
In the left pane of the Security Center window, under Detection, click Security Alerts. The Security Alerts dashboard appears. (See Figure 5-3.)
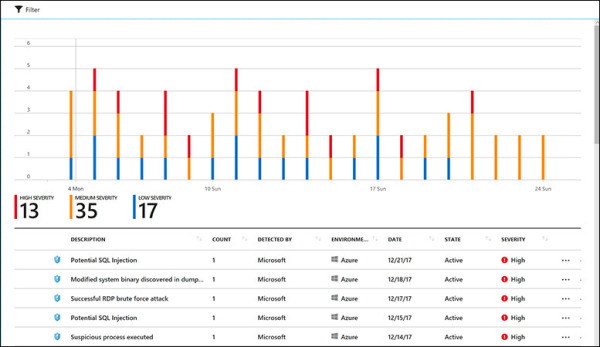
FIGURE 5-3 The Security Alerts dashboard.
The Security Alerts dashboard lists current alerts, organized by severity (with high-severity alerts listed first), and a bar graph showing the distribution of high-, medium-, and low-severity alerts. Click an alert type to open a new blade showing resources that have been flagged with the alert. (See Figure 5-4.)
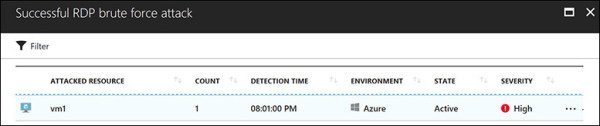
FIGURE 5-4 A list of attacked resources.
The list contains the following information about each attacked resource:
The name of the attacked resource
The number of times the resource was attacked
The time at which the attack was detected
The environment in which that the resource resides
The state of the alert
The severity of the alert
Click an attacked resource to see details about the attack, including the following. (See Figure 5-5. Note that the subscription ID has been intentionally obscured in this figure.)
A clear description of the attack
Attack-specific information, such as the source IP and the software used by the attacker
A list of steps to remediate the issue
Return to the main Security Center dashboard.
)
)

FIGURE 5-5 Details of a security alert.
Security incidents
Some attacks may happen in a completely isolated way. Others will be coordinated—that is, part of the same attack campaign. Security Center can identify correlations among these types of attacks and create a security incident that contains two or more related security alerts. To see how this works, follow these steps:
In the left pane of the Security Center window, under Detection, click Security Alerts. If Security Center has identified a security incident in your environment, it will create an alert marked by a different icon. (See the first two alerts in Figure 5-6.)
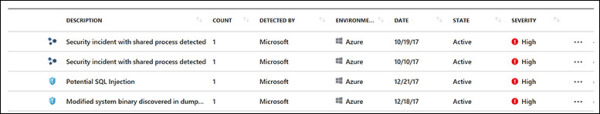
FIGURE 5-6 Security incidents appear in the Security Alert dashboard with a different icon.
Click a security incident. A new blade opens with more details about the incident. In the blade shown in Figure 5-7, the incident contains two alerts and two notable events. These notable events are contextual information that can help you during an investigation. (Note that the subscription ID and attacked resources have been intentionally hidden in the figure.)
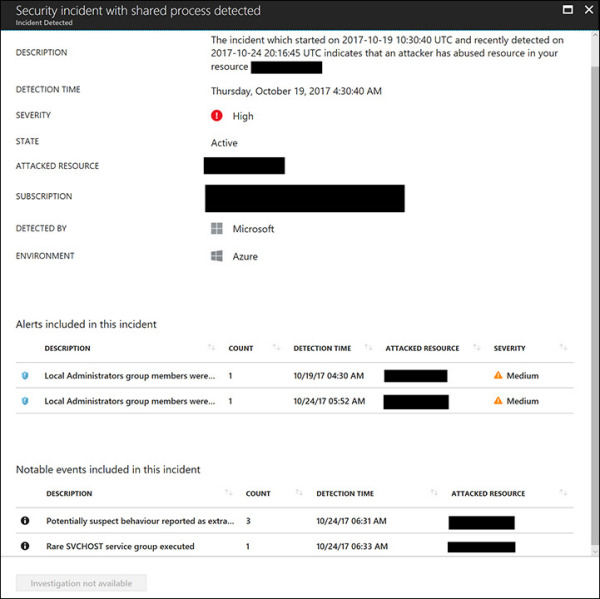
FIGURE 5-7 Details about a security incident.
Click an alert to see details about the alert. The details will be similar to those shown in Figure 5-5.
Click a notable event. This opens a page containing contextual data about the event. (See Figure 5-8.) This page shows the suspicious process name and the command line that was executed, and emphasizes other information that is relevant to your investigation.
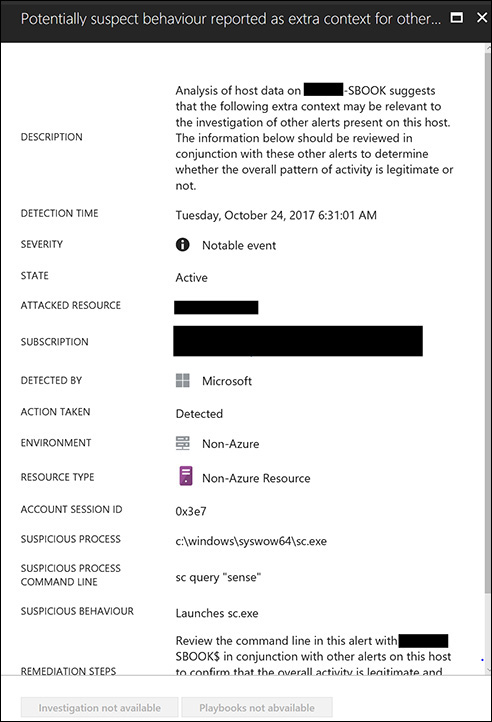
FIGURE 5-8 Contextual information with more details about an event.
Return to the main Security Center dashboard.
)
)
Custom alerts
Each environment may have its own unique processes that can be identified as suspicious. For example, your organization might consider it suspicious to run a particular executable file, but Security Center might not. To address this type of scenario, Security Center enables you to create your own custom alerts. Follow these steps to create a new custom alert:
In the left pane of the Security Center window, under Detection, click Custom Alert Rules. The Custom Alert Rules blade appears. (See Figure 5-9.)
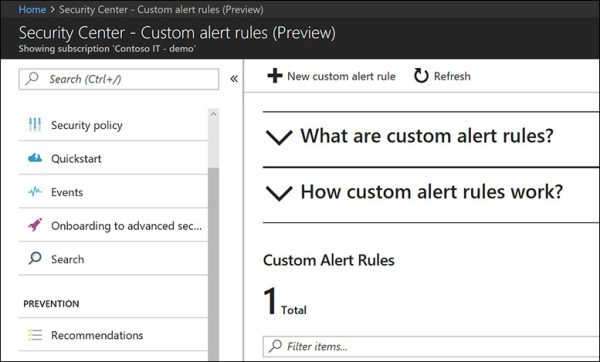
FIGURE 5-9 Creating a custom alert.
Click the New Custom Alert Rule button. The Create a Custom Alert Rule blade appears. (See Figure 5-10.)
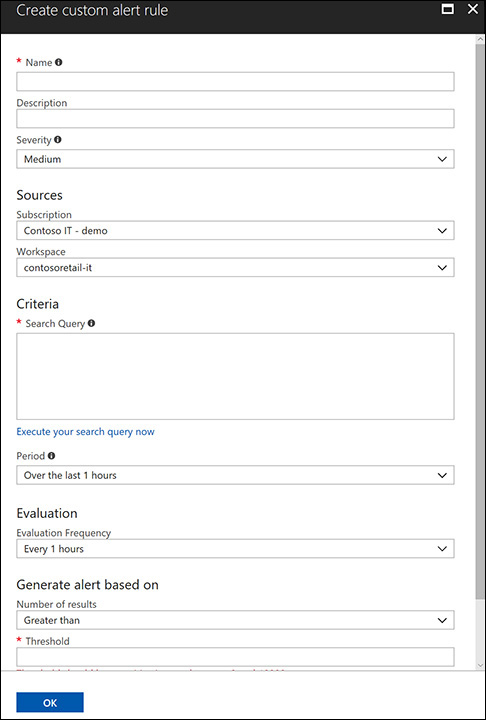
FIGURE 5-10 The Create Custom Alert Rule blade.
In the Name field, type the name for this rule.
In the Description field, type a brief description of the rule’s intent.
In the Severity drop-down list, select the severity level—High, Medium, or Low. Choose a level that reflects the priority of this alert for your security operations team.
In the Sources section, open the Subscription drop-down list and select the subscription that will be used by this custom rule.
Open the Workspace drop-down list and choose the workspace against which this rule should be running.
In the Search Query box in the Criteria section, search for the event you want to monitor. For example, if you want to monitor all security events whose identifier is 4688 and whose command line contains the word diskpart, type the following query and click the Execute Your Search Query Now link:
SecurityEvent | where EventID==4688 and CommandLine contains "diskpart"
In the Period drop-down list, select the time interval that should be used for this query. (By default, it will test over the last hour.)
In the Evaluation section, open the Evaluation Frequency drop-down list and specify how frequently this custom rule should be executed.
The Generate Alert Based On section contains two settings that are directly correlated: Number of Results and Threshold. Open the Number of Results drop-down list and choose Greater Than. Then, in the Threshold box, type 2. The alert will be triggered if the result for the query is greater than 2.
Select the Enable Suppress Alerts option if you want to set a time to wait before Security Center sends another alert for this rule.
Click OK to create the new rule. It will appear in the Custom Alert Rules section of the Custom Alert blade. (See Figure 5-11.)
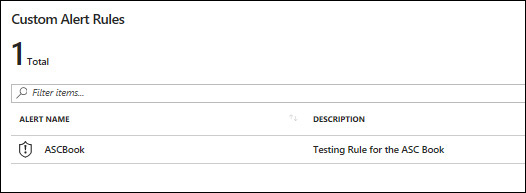
FIGURE 5-11 The new custom rule.
Now that you’ve created the new rule, alerts pertaining to this rule will appear with other alerts in the Security Alerts dashboard. (See Figure 5-12.)
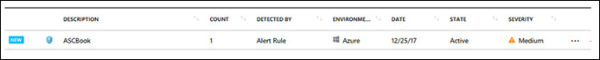
FIGURE 5-12 A new security alert based on the custom rule that was created.
)
)
)
)
)
)