The Managed Heap and Garbage Collection in the CLR

- By Jeffrey Richter
- 11/15/2012
- Managed Heap Basics
- Generations: Improving Performance
- Working with Types Requiring Special Cleanup
- Monitoring and Controlling the Lifetime of Objects Manually
Generations: Improving Performance
The CLR’s GC is a generational garbage collector (also known as an ephemeral garbage collector, although I don’t use the latter term in this book). A generational GC makes the following assumptions about your code:
-
The newer an object is, the shorter its lifetime will be.
-
The older an object is, the longer its lifetime will be.
-
Collecting a portion of the heap is faster than collecting the whole heap.
Numerous studies have demonstrated the validity of these assumptions for a very large set of existing applications, and these assumptions have influenced how the garbage collector is implemented. In this section, I’ll describe how generations work.
When initialized, the managed heap contains no objects. Objects added to the heap are said to be in generation 0. Stated simply, objects in generation 0 are newly constructed objects that the garbage collector has never examined. Figure 21-4 shows a newly started application with five objects allocated (A through E). After a while, objects C and E become unreachable.
)
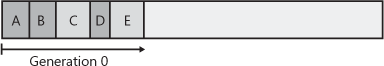
Figure 21-4 A newly initialized heap containing some objects, all in generation 0. No collections have occurred yet.
When the CLR initializes, it selects a budget size (in kilobytes) for generation 0. So if allocating a new object causes generation 0 to surpass its budget, a garbage collection must start. Let’s say that objects A through E fill all of generation 0. When object F is allocated, a garbage collection must start. The garbage collector will determine that objects C and E are garbage and will compact object D, causing it to be adjacent to object B. The objects that survive the garbage collection (objects A, B, and D) are said to be in generation 1. Objects in generation 1 have been examined by the garbage collector once. The heap now looks like Figure 21-5.
)
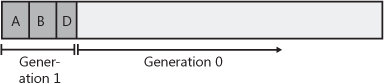
Figure 21-5 After one collection, generation 0 survivors are promoted to generation 1; generation 0 is empty.
After a garbage collection, generation 0 contains no objects. As always, new objects will be allocated in generation 0. Figure 21-6 shows the application running and allocating objects F through K. In addition, while the application was running, objects B, H, and J became unreachable and should have their memory reclaimed at some point.
)
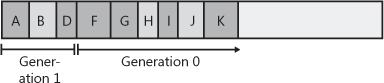
Figure 21-6 New objects are allocated in generation 0; generation 1 has some garbage.
Now let’s say that attempting to allocate object L would put generation 0 over its budget. Because generation 0 has reached its budget, a garbage collection must start. When starting a garbage collection, the garbage collector must decide which generations to examine. Earlier, I said that when the CLR initializes, it selects a budget for generation 0. Well, it also selects a budget for generation 1.
When starting a garbage collection, the garbage collector also sees how much memory is occupied by generation 1. In this case, generation 1 occupies much less than its budget, so the garbage collector examines only the objects in generation 0. Look again at the assumptions that the generational garbage collector makes. The first assumption is that newly created objects have a short lifetime. So generation 0 is likely to have a lot of garbage in it, and collecting generation 0 will therefore reclaim a lot of memory. The garbage collector will just ignore the objects in generation 1, which will speed up the garbage collection process.
Obviously, ignoring the objects in generation 1 improves the performance of the garbage collector. However, the garbage collector improves performance more because it doesn’t traverse every object in the managed heap. If a root or an object refers to an object in an old generation, the garbage collector can ignore any of the older objects’ inner references, decreasing the amount of time required to build the graph of reachable objects. Of course, it’s possible that an old object’s field refers to a new object. To ensure that the updated fields of these old objects are examined, the garbage collector uses a mechanism internal to the JIT compiler that sets a bit when an object’s reference field changes. This support lets the garbage collector know which old objects (if any) have been written to since the last collection. Only old objects that have had fields changed need to be examined to see whether they refer to any new object in generation 0. 2
A generational garbage collector also assumes that objects that have lived a long time will continue to live. So it’s likely that the objects in generation 1 will continue to be reachable from the application. Therefore, if the garbage collector were to examine the objects in generation 1, it probably wouldn’t find a lot of garbage. As a result, it wouldn’t be able to reclaim much memory. So it is likely that collecting generation 1 is a waste of time. If any garbage happens to be in generation 1, it just stays there. The heap now looks like Figure 21-7.
)
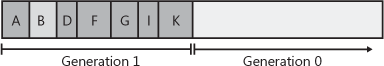
Figure 21-7 After two collections, generation 0 survivors are promoted to generation 1 (growing the size of generation 1); generation 0 is empty.
As you can see, all of the generation 0 objects that survived the collection are now part of generation 1. Because the garbage collector didn’t examine generation 1, object B didn’t have its memory reclaimed even though it was unreachable at the time of the last garbage collection. Again, after a collection, generation 0 contains no objects and is where new objects will be placed. In fact, let’s say that the application continues running and allocates objects L through O. And while running, the application stops using objects G, L, and M, making them all unreachable. The heap now looks like Figure 21-8.
)
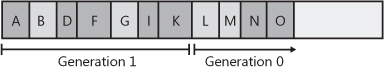
Figure 21-8 New objects are allocated in generation 0; generation 1 has more garbage.
Let’s say that allocating object P causes generation 0 to exceed its budget, causing a garbage collection to occur. Because the memory occupied by all of the objects in generation 1 is less than its budget, the garbage collector again decides to collect only generation 0, ignoring the unreachable objects in generation 1 (objects B and G). After the collection, the heap looks like Figure 21-9.
)
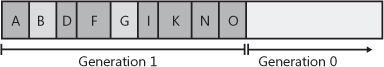
Figure 21-9 After three collections, generation 0 survivors are promoted to generation 1 (growing the size of generation 1 again); generation 0 is empty.
In Figure 21-9, you see that generation 1 keeps growing slowly. In fact, let’s say that generation 1 has now grown to the point in which all of the objects in it occupy its full budget. At this point, the application continues running (because a garbage collection just finished) and starts allocating objects P through S, which fill generation 0 up to its budget. The heap now looks like Figure 21-10.
)
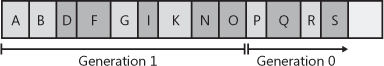
Figure 21-10 New objects are allocated in generation 0; generation 1 has more garbage.
When the application attempts to allocate object T, generation 0 is full, and a garbage collection must start. This time, however, the garbage collector sees that the objects in generation 1 are occupying so much memory that generation 1’s budget has been reached. Over the several generation 0 collections, it’s likely that a number of objects in generation 1 have become unreachable (as in our example). So this time, the garbage collector decides to examine all of the objects in generation 1 and generation 0. After both generations have been garbage collected, the heap now looks like Figure 21-11.
)
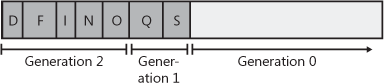
Figure 21-11 After four collections: generation 1 survivors are promoted to generation 2, generation 0 survivors are promoted to generation 1, and generation 0 is empty.
As before, any objects that were in generation 0 that survived the garbage collection are now in generation 1; any objects that were in generation 1 that survived the collection are now in generation 2. As always, generation 0 is empty immediately after a garbage collection and is where new objects will be allocated. Objects in generation 2 are objects that the garbage collector has examined two or more times. There might have been several collections, but the objects in generation 1 are examined only when generation 1 reaches its budget, which usually requires several garbage collections of generation 0.
The managed heap supports only three generations: generation 0, generation 1, and generation 2; there is no generation 3. 3 When the CLR initializes, it selects budgets for all three generations. However, the CLR’s garbage collector is a self-tuning collector. This means that the garbage collector learns about your application’s behavior whenever it performs a garbage collection. For example, if your application constructs a lot of objects and uses them for a very short period of time, it’s possible that garbage collecting generation 0 will reclaim a lot of memory. In fact, it’s possible that the memory for all objects in generation 0 can be reclaimed.
If the garbage collector sees that there are very few surviving objects after collecting generation 0, it might decide to reduce the budget of generation 0. This reduction in the allotted space will mean that garbage collections occur more frequently but will require less work for the garbage collector, so your process’s working set will be small. In fact, if all objects in generation 0 are garbage, a garbage collection doesn’t have to compact any memory; it can simply set NextObjPtr back to the beginning of generation 0, and then the garbage collection is performed. Wow, this is a fast way to reclaim memory!
On the other hand, if the garbage collector collects generation 0 and sees that there are a lot of surviving objects, not a lot of memory was reclaimed in the garbage collection. In this case, the garbage collector will grow generation 0’s budget. Now, fewer collections will occur, but when they do, a lot more memory should be reclaimed. By the way, if insufficient memory has been reclaimed after a collection, the garbage collector will perform a full collection before throwing an OutOfMemoryException.
Throughout this discussion, I’ve been talking about how the garbage collector dynamically modifies generation 0’s budget after every collection. But the garbage collector also modifies the budgets of generation 1 and generation 2 by using similar heuristics. When these generations are garbage collected, the garbage collector again sees how much memory is reclaimed and how many objects survived. Based on the garbage collector’s findings, it might grow or shrink the thresholds of these generations as well to improve the overall performance of the application. The end result is that the garbage collector fine-tunes itself automatically based on the memory load required by your application—this is very cool!
The following GCNotification class raises an event whenever a generation 0 or generation 2 collection occurs. With these events, you could have the computer beep whenever a collection occurs or you could calculate how much time passes between collections, how much memory is allocated between collections, and more. With this class, you could easily instrument your application to get a better understanding of how your application uses memory.
public static class GCNotification {
   private static Action<Int32> s_gcDone = null;  // The event's field

   public static event Action<Int32> GCDone {
      add {
         // If there were no registered delegates before, start reporting notifications no
w
         if (s_gcDone == null) { new GenObject(0); new GenObject(2); }
         s_gcDone += value;
      }
      remove { s_gcDone -= value; }
   }

   private sealed class GenObject {
      private Int32 m_generation;
      public GenObject(Int32 generation) { m_generation = generation; }
      ~GenObject() { // This is the Finalize method
         // If this object is in the generation we want (or higher),
         // notify the delegates that a GC just completed
         if (GC.GetGeneration(this) >= m_generation) {
            Action<Int32> temp = Volatile.Read(ref s_gcDone);
            if (temp != null) temp(m_generation);
         }

         // Keep reporting notifications if there is at least one delegate registered,
         // the AppDomain isn't unloading, and the process isn't shutting down
         if ((s_gcDone != null)
            && !AppDomain.CurrentDomain.IsFinalizingForUnload()
            && !Environment.HasShutdownStarted) {
               // For Gen 0, create a new object; for Gen 2, resurrect the object
               // & let the GC call Finalize again the next time Gen 2 is GC'd
            if (m_generation == 0) new GenObject(0);
            else GC.ReRegisterForFinalize(this);
         } else { /* Let the objects go away */ }
      }
   }
}
Garbage Collection Triggers
As you know, the CLR triggers a GC when it detects that generation 0 has filled its budget. This is the most common trigger of a GC; however, there are additional GC triggers as listed here:
-
Code explicitly calls System.GC’s static Collect method Code can explicitly request that the CLR perform a collection. Although Microsoft strongly discourages such requests, at times it might make sense for an application to force a collection. I discuss this more in the "Forcing Garbage Collections" section later in this chapter.
-
Windows is reporting low memory conditions The CLR internally uses the Win32 CreateMemoryResourceNotification and QueryMemoryResourceNotification functions to monitor system memory overall. If Windows reports low memory, the CLR will force a garbage collection in an effort to free up dead objects to reduce the size of a process’s working set.
-
The CLR is unloading an AppDomain When an AppDomain unloads, the CLR considers nothing in the AppDomain to be a root, and a garbage collection consisting of all generations is performed. I’ll discuss AppDomains in Chapter 22. "CLR Hosting and AppDomains"
-
The CLR is shutting down The CLR shuts down when a process terminates normally (as opposed to an external shutdown via Task Manager, for example). During this shutdown, the CLR considers nothing in the process to be a root; it allows objects a chance to clean up but the CLR does not attempt to compact or free memory because the whole process is terminating, and Windows will reclaim all of the processes’ memory.
Large Objects
There is one more performance improvement you might want to be aware of. The CLR considers each single object to be either a small object or a large object. So far, in this chapter, I’ve been focusing on small objects. Today, a large object is 85,000 bytes or more in size.4 The CLR treats large objects slightly differently than how it treats small objects:
-
Large objects are not allocated within the same address space as small objects; they are allocated elsewhere within the process’ address space.
-
Today, the GC doesn’t compact large objects because of the time it would require to move them in memory. For this reason, address space fragmentation can occur between large objects within the process leading to an OutOfMemoryException being thrown. In a future version of the CLR, large objects may participate in compaction.
-
Large objects are immediately considered to be part of generation 2; they are never in generation 0 or 1. So, you should create large objects only for resources that you need to keep alive for a long time. Allocating short-lived large objects will cause generation 2 to be collected more frequently, hurting performance. Usually large objects are large strings (like XML or JSON) or byte arrays that you use for I/O operations, such as reading bytes from a file or network into a buffer so you can process it.
For the most part, large objects are transparent to you; you can simply ignore that they exist and that they get special treatment until you run into some unexplained situation in your program (like why you’re getting address space fragmentation).
Garbage Collection Modes
When the CLR starts, it selects a GC mode, and this mode cannot change during the lifetime of the process. There are two basic GC modes:
-
Workstation This mode fine-tunes the garbage collector for client-side applications. It is optimized to provide for low-latency GCs in order to minimize the time an application’s threads are suspended so as not to frustrate the end user. In this mode, the GC assumes that other applications are running on the machine and does not hog CPU resources.
-
Server This mode fine-tunes the garbage collector for server-side applications. It is optimized for throughput and resource utilization. In this mode, the GC assumes no other applications (client or server) are running on the machine, and it assumes that all the CPUs on the machine are available to assist with completing the GC. This GC mode causes the managed heap to be split into several sections, one per CPU. When a garbage collection is initiated, the garbage collector dedicates one special thread per CPU; each thread collects its own section in parallel with the other threads. Parallel collections work well for server applications in which the worker threads tend to exhibit uniform behavior. This feature requires the application to be running on a computer with multiple CPUs so that the threads can truly be working simultaneously to attain a performance improvement.
By default, applications run with the Workstation GC mode. A server application (such as ASP.NET or Microsoft SQL Server) that hosts the CLR can request the CLR to load the Server GC. However, if the server application is running on a uniprocessor machine, then the CLR will always use Workstation GC mode. A stand-alone application can tell the CLR to use the Server GC mode by creating a configuration file (as discussed in Chapter 2, "Building, Packaging, Deploying, and Administering Applications and Types," and Chapter 3, "Shared Assemblies and Strongly Named Assemblies") that contains a gcServer element for the application. Here’s an example of a configuration file.
<configuration>
    <runtime>
        <gcServer enabled="true"/>
    </runtime>
</configuration>
When an application is running, it can ask the CLR if it is running in the Server GC mode by querying the GCSettings class’s IsServerGC read-only Boolean property.
using System;
using System.Runtime; // GCSettings is in this namespace

public static class Program {
   public static void Main() {
      Console.WriteLine("Application is running with server GC=" + GCSettings.IsServerGC);
    }
}
In addition to the two modes, the GC can run in two sub-modes: concurrent (the default) or non-concurrent. In concurrent mode, the GC has an additional background thread that marks objects concurrently while the application runs. When a thread allocates an object that pushes generation 0 over its budget, the GC first suspends all threads and then determines which generations to collect. If the garbage collector needs to collect generation 0 or 1, it proceeds as normal. However, if generation 2 needs collecting, the size of generation 0 will be increased beyond its budget to allocate the new object, and then the application’s threads are resumed.
While the application’s threads are running, the garbage collector has a normal priority background thread that finds unreachable objects. Once found, the garbage collector suspends all threads again and decides whether to compact memory. If the garbage collector decides to compact memory, memory is compacted, root references are fixed up, and the application’s threads are resumed. This garbage collection takes less time than usual because the set of unreachable objects has already been built. However, the garbage collector might decide not to compact memory; in fact, the garbage collector favors this approach. If you have a lot of free memory, the garbage collector won’t compact the heap; this improves performance but grows your application’s working set. When using the concurrent garbage collector, you’ll typically find that your application is consuming more memory than it would with the non-concurrent garbage collector.
You can tell the CLR not to use the concurrent collector by creating a configuration file for the application that contains a gcConcurrent element. Here’s an example of a configuration file.
<configuration>
   <runtime>
      <gcConcurrent enabled="false"/>
   </runtime>
</configuration>
The GC mode is configured for a process and it cannot change while the process runs. However, your application can have some control over the garbage collection by using the GCSettings class’s GCLatencyMode property. This read/write property can be set to any of the values in the GCLatencyMode enumerated type, as shown in Table 21-1.
The LowLatency mode requires some additional explanation. Typically, you would set this mode, perform a short-term, time-sensitive operation, and then set the mode back to either Batch or Interactive. While the mode is set to LowLatency, the GC will really avoid doing any generation 2 collections because these could take a long time. Of course, if you call GC.Collect(), then generation 2 still gets collected. Also, the GC will perform a generation 2 collection if Windows tells the CLR that system memory is low (see the "Garbage Collection Triggers" section earlier in this chapter).
Table 21-1. Symbols Defined by the GCLatencyMode Enumerated Type
Symbol Name |
Description |
Batch (default for the Server GC mode) |
Turns off the concurrent GC. |
Interactive (default for the Workstation GC mode) |
Turns on the concurrent GC. |
LowLatency |
Use this latency mode during short-term, time-sensitive operations (like drawing animations) where a generation 2 collection might be disruptive. |
SustainedLowLatency |
Use this latency mode to avoid long GC pauses for the bulk of your application’s execution. This setting prevents all blocking generation 2 collections from occurring as long as memory is available. In fact, users of these applications would prefer to install more RAM in the machine in order to avoid GC pauses. A stock market application that must respond immediately to price changes is an example of this kind of application. |
Under LowLatency mode, it is more likely that your application could get an OutOfMemoryException thrown. Therefore, stay in this mode for as short a time as possible, avoid allocating many objects, avoid allocating large objects, and set the mode back to Batch or Interactive by using a constrained execution region (CER), as discussed in Chapter 20, "Exceptions and State Management." Also, remember that the latency mode is a process-wide setting and threads may be running concurrently. These other threads could even change this setting while another thread is using it, so you may want to update some kind of counter (manipulated via Interlocked methods) when you have multiple threads manipulating this setting. Here is some code showing how to use the LowLatency mode.
private static void LowLatencyDemo() {
   GCLatencyMode oldMode = GCSettings.LatencyMode;
   System.Runtime.CompilerServices.RuntimeHelpers.PrepareConstrainedRegions();
   try {
      GCSettings.LatencyMode = GCLatencyMode.LowLatency;
      // Run your code here...
   }
   finally {
      GCSettings.LatencyMode = oldMode;
   }
}
Forcing Garbage Collections
The System.GC type allows your application some direct control over the garbage collector. For starters, you can query the maximum generation supported by the managed heap by reading the GC.MaxGeneration property; this property always returns 2.
You can also force the garbage collector to perform a collection by calling GC class’s Collect method, optionally passing in a generation to collect up to, a GCCollectionMode, and a Boolean indicating whether you want to perform a blocking (non-current) or background (concurrent) collection. Here is the signature of the most complex overload of the Collect method.
void Collect(Int32 generation, GCCollectionMode mode, Boolean blocking);
The GCCollectionMode type is an enum whose values are described in Table 21-2.
Table 21-2. Symbols Defined by the GCCollectionMode Enumerated Type
Symbol Name |
Description |
|
Default |
The same as calling GC.Collect with no flag. Today, this is the same as passing Forced, but this may change in a future version of the CLR. |
|
Forced |
Forces a collection to occur immediately for all generations up to and including the specified generation. |
|
Optimized |
The garbage collector will only perform a collection if the collection would be productive either by freeing a lot of memory or by reducing fragmentation. If the garbage collection would not be productive, then the call has no effect |
Under most circumstances, you should avoid calling any of the Collect methods; it’s best just to let the garbage collector run on its own accord and fine-tune its generation budgets based on actual application behavior. However, if you’re writing a console user interface (CUI) or GUI application, your application code owns the process and the CLR in that process. For these application types, you might want to suggest a garbage collection to occur at certain times using a GCCollectionMode of Optimized. Normally, modes of Default and Forced are used for debugging, testing, and looking for memory leaks.
For example, you might consider calling the Collect method if some non-recurring event has just occurred that has likely caused a lot of old objects to die. The reason that calling Collect in such a circumstance may not be so bad is that the GC’s predictions of the future based on the past are not likely to be accurate for non-recurring events. For example, it might make sense for your application to force a full GC of all generations after your application initializes or after the user saves a data file. Because calling Collect causes the generation budgets to adjust, do not call Collect to try to improve your application’s response time; call it to reduce your process’s working set.
For some applications (especially server applications that tend to keep a lot of objects in memory), the time required for the GC to do a full collection that includes generation 2 can be excessive. In fact, if the collection takes a very long time to complete, then client requests might time out. To help these kinds of applications, the GC class offers a RegisterForFullGCNotification method. Using this method and some additional helper methods (WaitForFullGCApproach, WaitForFullGCComplete, and CancelFullGCNotification), an application can now be notified when the garbage collector is getting close to performing a full collection. The application can then call GC.Collect to force a collection at a more opportune time, or the application could communicate with another server to better load balance the client requests. For more information, examine these methods and the “Garbage Collection Notifications” topic in the Microsoft .NET Framework SDK documentation. Note that you should always call the WaitForFullGCApproach and WaitForFullGCComplete methods in pairs because the CLR handles them as pairs internally.
Monitoring Your Application’s Memory Usage
Within a process, there are a few methods that you can call to monitor the garbage collector. Specifically, the GC class offers the following static methods, which you can call to see how many collections have occurred of a specific generation or how much memory is currently being used by objects in the managed heap.
Int32 CollectionCount(Int32 generation);
Int64 GetTotalMemory(Boolean forceFullCollection);
To profile a particular code block, I have frequently written code to call these methods before and after the code block and then calculate the difference. This gives me a very good indication of how my code block has affected my process’s working set and indicates how many garbage collections occurred while executing the code block. If the numbers are high, I know to spend more time tuning the algorithms in my code block.
You can also see how much memory is being used by individual AppDomains as opposed to the whole process. For more information about this, see the "AppDomain Monitoring" section in Chapter 22.
When you install the .NET Framework, it installs a set of performance counters that offer a lot of real-time statistics about the CLR’s operations. These statistics are visible via the PerfMon.exe tool or the System Monitor ActiveX control that ships with Windows. The easiest way to access the System Monitor control is to run PerfMon.exe and click the + toolbar button, which causes the Add Counters dialog box shown in Figure 21-12 to appear.
)
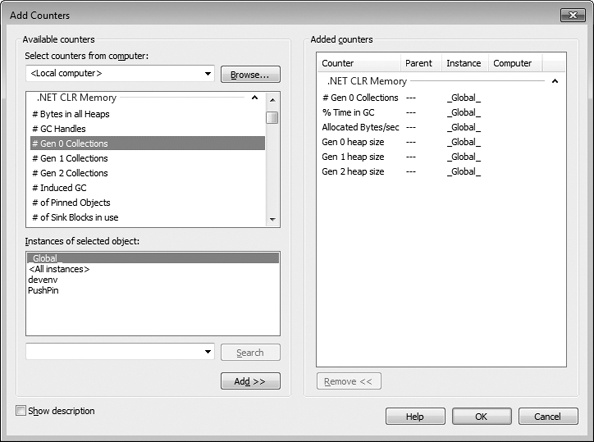
Figure 21-12 PerfMon.exe showing the .NET CLR Memory counters.
To monitor the CLR’s garbage collector, select the .NET CLR Memory performance object. Then select a specific application from the instance list box. Finally, select the set of counters that you’re interested in monitoring, click Add, and then click OK. At this point, the System Monitor will graph the selected real-time statistics. For an explanation of a particular counter, select the desired counter and then select the Show Description check box.
Another great tool for analyzing the memory and performance of your application is PerfView. This tool can collect Event Tracing for Windows (ETW) logs and process them. The best way to acquire this tool is for you to search the web for PerfView. Finally, you should look into using the SOS Debugging Extension (SOS.dll), which can often offer great assistance when debugging memory problems and other CLR problems. For memory-related actions, the SOS Debugging Extension allows you to see how much memory is allocated within the process to the managed heap, displays all objects registered for finalization in the finalization queue, displays the entries in the GCHandle table per AppDomain or for the entire process, shows the roots that are keeping an object alive in the heap, and more.