Planning Microsoft Defender for Cloud adoption
- By Yuri Diogenes and Tom Janetscheck
- 12/17/2022
- Deployment scenarios
- Understanding Defender for Cloud
- Planning adoption
Understanding Defender for Cloud
Because Defender for Cloud is an Azure service, you must have an Azure subscription to use it, even if it’s just a trial subscription.
When you enable Defender for Cloud in an Azure subscription, you will initially experience the benefits of the free tier. This free tier provides security policy, security assessment, security recommendations, and Secure Score. In addition to the free tier, Defender for Cloud offers an option to upgrade to enhanced security. This option offers a complete set of security capabilities for organizations that need more control and threat detection. The capabilities will vary according to which plan you enabled. For example, if you enable Defender for Servers, you will get the following features:
Security event collection
Network Map
Just-in-time VM Access
Adaptive application controls
Adaptive network hardening
Regulatory compliance reports
File integrity monitoring
Security alerts
Integration with Microsoft Defender for Endpoint (MDE)
Multi-cloud support for Amazon Web Services (AWS) and Google Cloud Platform (GCP)
Capability to monitor on-premises resources
Vulnerability assessment integration with Qualys and Microsoft Threat and Vulnerability Management (TVM)
In addition to Defender for Servers, you have other plans that offer tailored threat detection for specific workloads. The list below provides the other plans available:
Defender for Storage
Defender for SQL
Defender for Open Relational Database
Defender for Azure Comos DB
Defender for Key Vault
Defender for DNS
Defender for App Services
Defender for Resource Manager
Defender for Containers
When you upgrade to a Defender for Cloud plan, you can use it free for 30 days. This is a good opportunity to evaluate these features, see how your current environment will benefit from them, and decide whether they’re worth the investment.
Defender for Cloud architecture
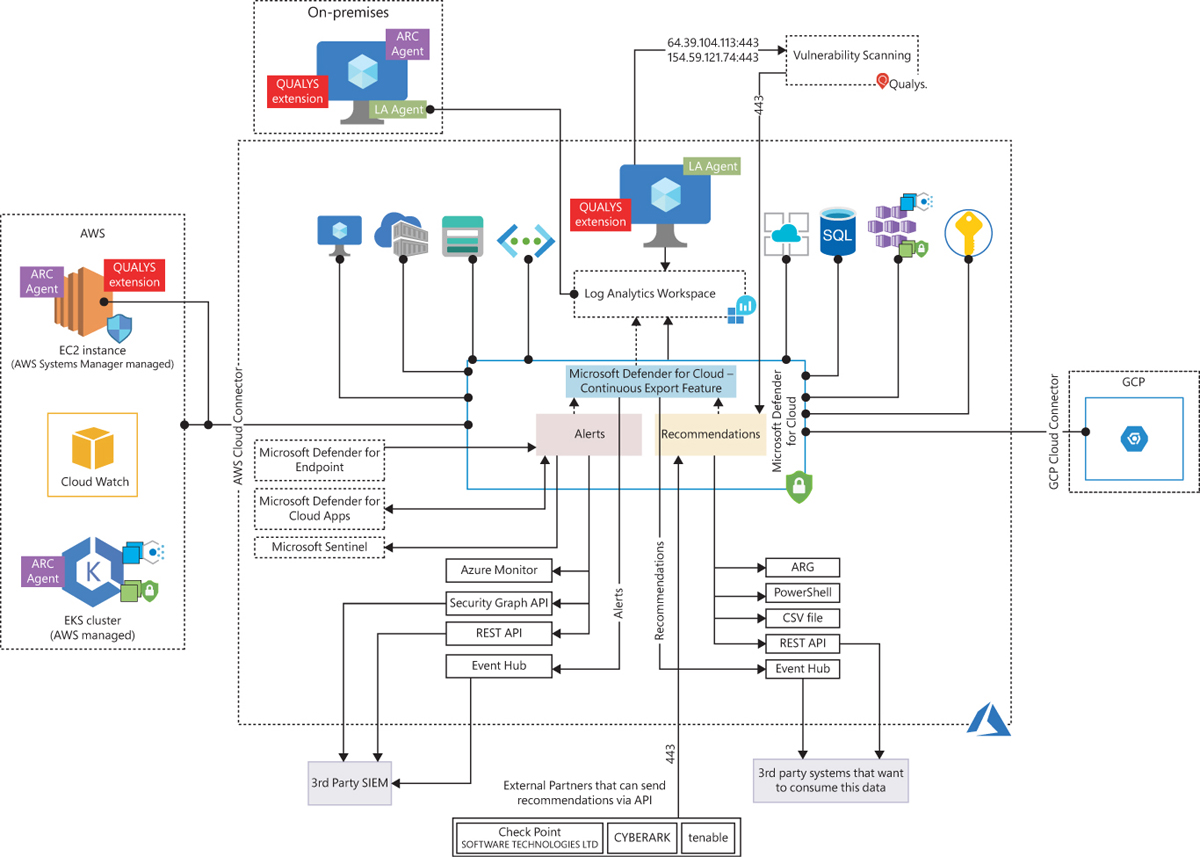
To better understand how Defender for Cloud communicates with different resources, it is important to understand its core architecture. Figure 2-1 shows the Defender for Cloud architecture and how it interacts with external components.

FIGURE 2-1 Defender for Cloud architecture
In Figure 2-1, if you look at the core diagram representing Defender for Cloud, you will see three major boxes: Recommendations, Alerts, and Continuous Export. The recommendations are an important component of the CSPM scenario because it is via the remediation of these security recommendations that you will enhance your security posture. Alerts contain the security alerts that are triggered when suspicious activities are identified. Alerts are based on a variety of threat detections, which are enabled when you enable a Defender for Cloud plan. Recommendations and alerts can be streamed to the Log Analytics workspace of your choice using the Continuous Export feature, and they can also be streamed to an Event Hub to be consumed by a third-party Security Information and Event Management (SIEM) system.
Recommendations can also be received based on the connectivity with other cloud providers such as AWS and GCP, which you will learn how to onboard in the next chapter. Another form of ingesting external recommendations is via third-party partners, which usually sends those recommendations via the Application Program Interface (API). By the time this chapter was written, the partners available were Tenable, Cyberark, and Checkpoint.
Defender for Cloud uses the Log Analytics Agent, which is configured to send information to a particular Log Analytics workspace. Regardless of the VM location (in Azure or not), the agent must always be installed to enable Defender for Cloud to have more visibility about the machine’s security events. In Windows systems, Defender for Cloud installs the Log Analytics Agent. In addition to the agent for Linux, Defender for Cloud also creates the omsagent daemon, which runs under the omsagent account. This account is automatically created during agent installation.
In Linux systems, Defender for Cloud collects audit records from Linux machines using the auditd framework. (It doesn’t require the auditd daemon to be running.) The auditd system consists of two major components:
First is a set of user-space utilities offering a wide collection of operations allowing administrators to better adjust rules, analyze audit log files, or troubleshoot if things are misconfigured.
Second is a kernel-level subsystem that is responsible for monitoring system calls, filtering them by a given rule set, and writing match messages to a buffer.
Both components are communicating through a netlink socket. Auditd records are collected, aggregated into events, and enriched using the latest version of the Log Analytics Agent for Linux.
In Windows systems, the Log Analytics Agent scans for various security-related configurations and events in Event Tracing for Windows (ETW) traces. Also, this agent collects the following:
Operating system logs, such as Windows events
Operating system type and version
Running processes
Machine name
IP addresses
Logged in user (username)
Tenant ID
User mode crash dump created by Windows Error Reporting (WER)
This information is sent to your workspace, which is an Azure resource used as a container to store your data. A workspace provides a geographic location for data storage, granularity for billing and data isolation, and helps you to better scope the configuration.
If you are using Azure Log Analytics, and you already have a Log Analytics workspace, this workspace can be used by Defender for Cloud to store data coming from the agent. If you are not using Azure Log Analytics, a new workspace will be automatically created when you start using Defender for Cloud. When using the default workspace provisioning configuration, the location of the workspace created by Defender for Cloud is based on the geolocation of the VM.
If you are a global company and need to store data in specific regions for data sovereignty or compliance reasons, you might consider creating multiple workspaces. Another scenario that might call for multiple workspaces is if you want to isolate various users. For example, you might want each customer, department, or business group to see its own data but not the data of others. There will also be scenarios where you may want to utilize a centralized workspace, for example when all subscriptions want to consolidate the recommendations and alerts exported by the continuous exported feature in a single location.
By default, only VM-Based alerts are stored in the workspace; in other words, only alerts generated by Defender for Servers are stored in the workspace. This means even if you have multiple Defender for Cloud Plans enabled, such as Defender for Storage and Defender for Key Vault, the alerts generated are not stored in the workspace. If you need to store the alerts in the workspace, you need to use the Continuous Export feature.
An important point shown in Figure 2-1 is the vulnerability assessment integration with Qualys. When you enable this integration, the agent installed in the VM needs to have access (TCP 443—the default for HTTPS) to Qualys data centers in the United States and Europe (hence the IP addresses shown in the diagram). Another important point about this architecture is the integration with Azure Arc. Figure 2-1 shows some examples of the scenarios where Azure Arc is needed, such as when you are onboarding VMs and Kubernetes located in AWS, GCP, or on-premises infrastructure.
Defender for Cloud dashboard
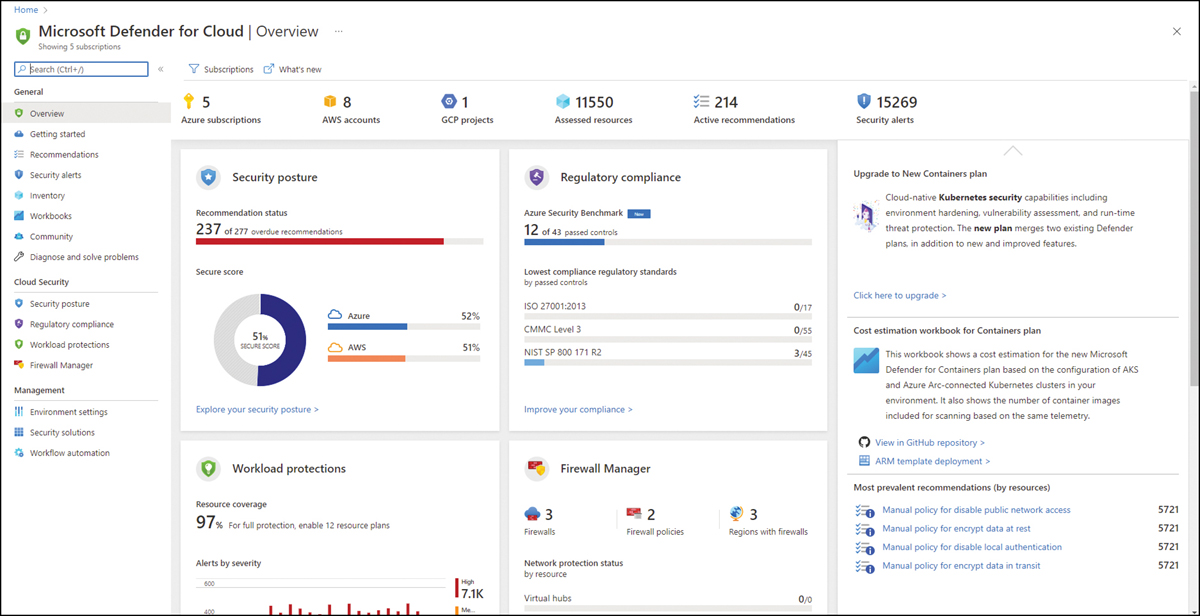
To access the Defender for Cloud dashboard, sign in to the Azure portal (https://portal.azure.com) and click the Microsoft Defender For Cloud icon in the left pane. What happens the first time you open the Defender for Cloud dashboard may vary according to the types of workloads that you have on your Azure subscription. For the purposes of this example, the dashboard is fully populated with resources, recommendations, and alerts, as shown in Figure 2-2.

FIGURE 2-2 Overview page in Defender for Cloud dashboard
By default, the Overview page is highlighted when you open the Defender for Cloud dashboard. This page brings a comprehensive layout that enables you to quickly see important indicators. From the top down, you will see which cloud providers you are connected with (Azure subscriptions, AWS account, and GCP Projects), followed by the number of assessed resources, the total of active recommendations, and security alerts.
Below that are a series of tiles; the first one is the Security Posture, which you will learn more about in Chapter 5, “Strengthening your security posture.” This tile lets you quickly see the Secure Score for your Azure subscription. In addition, if you are connected with AWS and GCP, you will also see the Secure Score for those cloud providers.
The next tile is Regulatory Compliance, which shows some statistics about your journey to compliance with different industry standards. The main statistic is the Azure Security Benchmark, which is the foundation of Defender for Cloud recommendations. Besides that, you also see the lowest compliance based on different industry standards.
Below the Regulatory Compliance tile is the Firewall Manager tile, which brings a summary of Azure network security-related products that are enabled on this Azure subscription. The content of this tile may vary according to the available Azure network security products that are currently in use on the selected subscription. If multiple subscriptions are selected, this tile will show the aggregated result.
Below the Security Posture tile is the Workload Protections tile, which contains a brief description of the current number (in percentage format) of resources covered in the selected subscription and a timeline chart with the alerts by severity. The entire right side of the page contains dynamic content that will be refreshed as necessary. This includes insights about alerts, quick access to see which workloads are not protected, and top recommendations.
