Visuals in Power BI

- By Errin O'Connor
- 4/5/2019
Third-party visuals in Power BI
Power BI includes several useful visuals. But if none of these visuals meet your needs, you can download and import several third-party visuals into Power BI. There are two ways to obtain these visuals:
By downloading a third-party visual file from the Microsoft AppSource and importing it into Power BI
By accessing the Microsoft AppSource directly from Power BI via the Import option
Download and import a third-party visual file into Power BI
To download a third-party visual from the Microsoft AppSource and import it into Power BI, follow these steps:
Type https://appsource.microsoft.com/en-us/marketplace/apps?page=1&product=power-bi-visuals in your web browser’s address bar.
The Microsoft AppSource opens. Under the third-party visual you want to download, click Get It Now. (See screen 1 in Figure 3-7.)
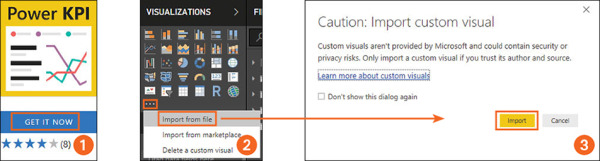
Figure 3-7 Importing a third-party visual.
When prompted, enter your work email address and your Power BI password, and click Continue to accept the terms and conditions.
Power BI Desktop will download a PBVIZ file.
In Power BI Desktop, click the … link in the Visualizations pane and choose Import from File. (See screen 2 in Figure 3-7.)
A Caution: Import Custom Visual dialog box opens. (See screen 3 in Figure 3-7.) Click the Import button.
Locate and select the file you just downloaded and click Import.
After the import operation, you’ll see the following message: The visual was successfully imported into this report. You can then select the visual from the Visualizations pane.
)
Access the Microsoft AppSource directly to import a third-party visual
To access the Microsoft AppSource from within Power BI to directly import a third-party visual, follow these steps:
In Power BI Desktop, click the … link in the Visualizations pane and choose Import from Marketplace. (Refer to screen 2 in Figure 3-7.)
The Microsoft AppSource opens and displays a list of third-party visuals. Select a visual and click the Add button.
After the import operation, you’ll see the following message: The visual was successfully imported into this report. You can then select the visual from the Visualizations pane.
OTHER WAYS TO IMPORT THIRD-PARTY VISUALS INTO POWER BI
In addition to using the … menu in the Visualizations pane to access options to import a third-party visual from a file or from the Microsoft AppSource (refer to screen 2 in Figure 3-7), you can also use the File menu (see screen 1 in Figure 3-8) or options in the Home tab (see screen 2 in Figure 3-8).
)
Figure 3-8 Other ways to import third-party visuals into Power BI.