Using Security Center for incident response
- By Yuri Diogenes and Tom Shinder
- 8/23/2018
- Understanding security alerts
- Detection scenarios
- Accessing security alerts
- Investigating a security issue
- Responding to a security alert
Investigating a security issue
In some scenarios, the information you obtain from a security alert can be enough for your incident-response team to conduct an investigation and identify the root cause of the issue. However, in some circumstances, you may need more details to understand the correlation between alerts and how the attack was performed. In Security Center, you can use the Investigation feature to obtain this information. Follow these steps:
In the left pane of the Security Center window, under Detection, click Security Alerts.
In the Security Alerts dashboard, click the security alert that you want to investigate.
Select the attacked resource you want to investigate. Then click the Investigate option at the bottom of the security alert page. (After you click the Investigate option for an alert, it changes to a Continue an Investigation option.) The Investigation dashboard appears. (See Figure 5-13.)
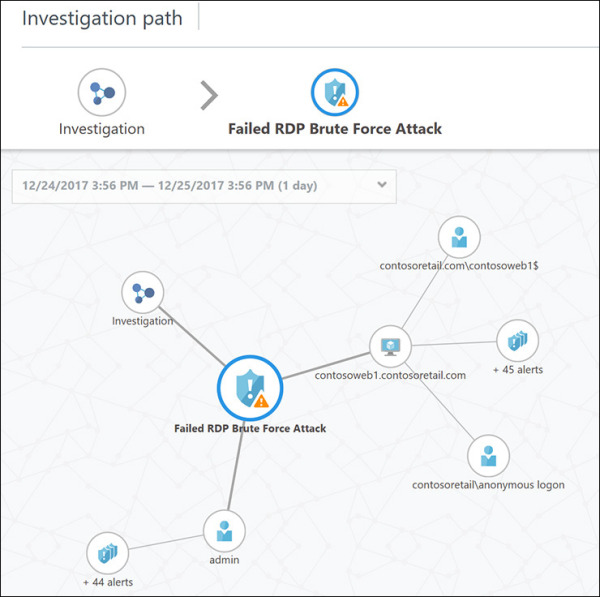
FIGURE 5-13 The Investigation dashboard with a security incident selected.
On the left side of the Investigation dashboard is the investigation path and map. The relevant entities (security alerts, computer, users, and security incidents) appear correlated in the map, and the timeline shows the current data interval for this investigation. On the right side are the attributes for the selected entity in the map. For example, Figure 5-14 shows the attributes for the entity selected in Figure 5-13.
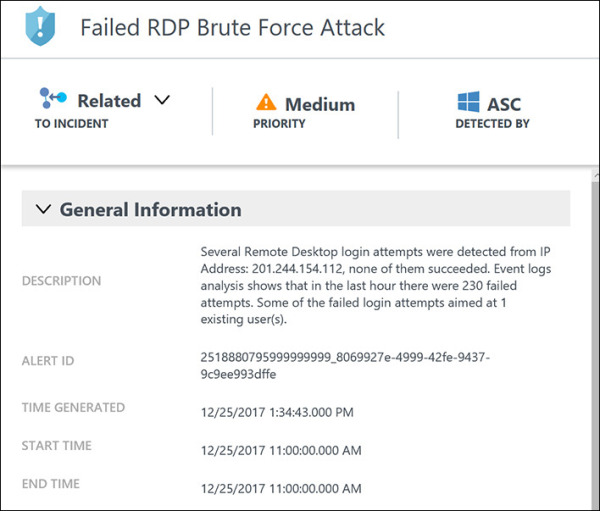
FIGURE 5-14 Security incident detected attributes.
The approach you take when investigating a security issue may vary depending on the attack, the amount of information available, and what you already know about the attack. For this example, one option would be to analyze the information available from the resource that was attacked—in this case, contosoweb1.
In the investigation map, click contosweb1 to see more details about it. Notice that the investigation map also changes. (See Figure 5-15.) As you can see, there are more than 45 alerts on this server, and there have been anonymous login attempts from the contosoretail domain.
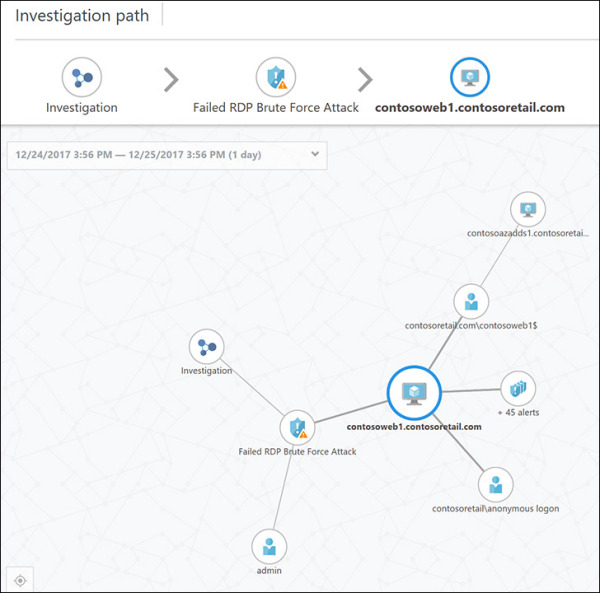
FIGURE 5-15 The investigation map reflects the selected entity.
To explore further, click the Exploration option in the right pane. (See Figure 5-16.)
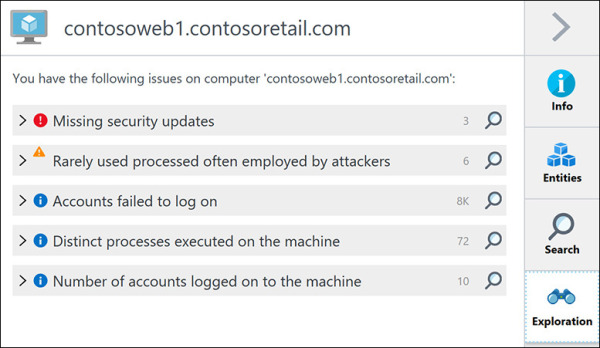
FIGURE 5-16 Exploring more options for the selected entity.
Review all the events in the Exploration page. These will be very important for your investigation and can help you understand how the attack took place.
Repeat steps 4–6 for each relevant entity in the investigation map. As the map redraws itself, it will become clearer how the attack took place and which systems were compromised.
As you click each entity, the options available to you may change depending on the entity type.
To see all entities correlated with the entity you’ve selected on the map, click the Entities option. The example shown in Figure 5-17 displays two entities (Alerts and Computers) that are correlated with the selected user on the map.
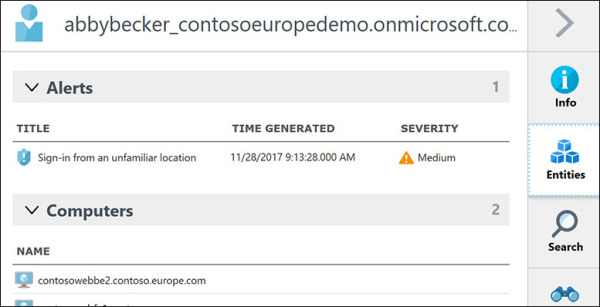
FIGURE 5-17 Entities correlation.
To visualize events correlated with the selected entity, click the Search option. The example in Figure 5-18 shows the events correlated with a server.
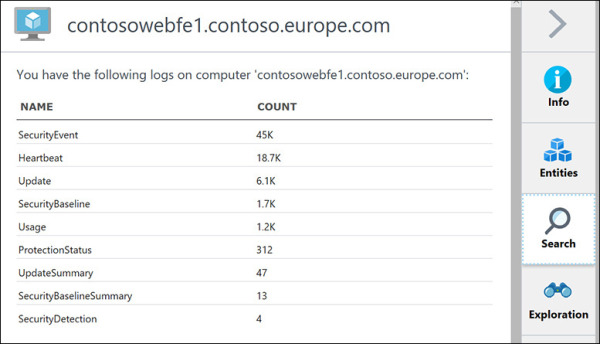
FIGURE 5-18 Events correlated with the selected entity.
Click one of the events. The Log Search dashboard from Log Analytics opens and shows all records.
As you continue to investigate each entity, you may find that Security Center will flag an entity as unrelated to the incident. (See Figure 5-19.)
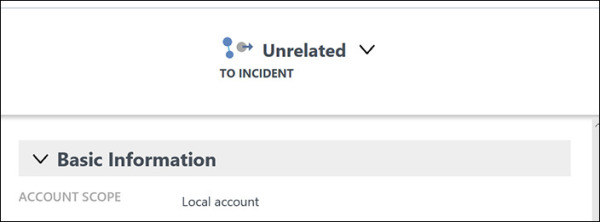
FIGURE 5-19 Security Center may flag an entity as unrelated to the incident.
Usually, this determination is accurate. However, in some scenarios, you may find that a correlation between that entity and the incident does exist. In that case, you’ll want to manually change that flag.
To change the flag, click the drop-down arrow next to the Unrelated heading, select Related, and choose a reason in the drop-down list. (See Figure 5-20.)
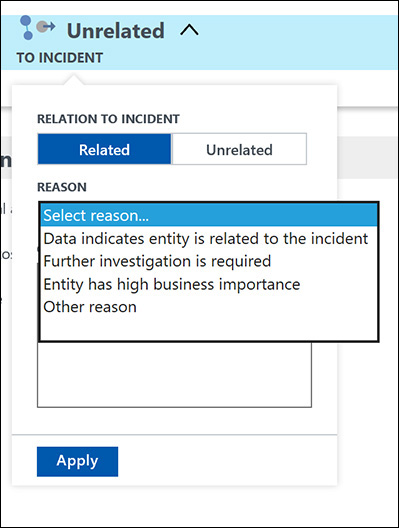
FIGURE 5-20 Changing the entity relation with the incident.
)
)
)
)
)
)
)
)