Design and implement Azure PaaS compute and web and mobile services
- By Michele Leroux Bustamante, Ike Ellis, Zoiner Tejada
- 4/7/2018
- Skill 4.1: Design Azure App Service Web Apps
- Skill 4.2: Design Azure App Service API Apps
- Skill 4.3: Develop Azure App Service Logic Apps
- Skill 4.4: Develop Azure App Service Mobile Apps
- Skill 4.5: Implement API Management
- Skill 4.6: Implement Azure Functions and WebJobs
- Skill 4.7: Design and Implement Azure Service Fabric apps
- Skill 4.8: Design and implement third-party Platform as a Service (PaaS)
- Skill 4.9: Design and implement DevOps
- Thought experiment
- Thought experiment answers
- Chapter summary
Skill 4.9: Design and implement DevOps
DevOps is a combination of Development (Dev) and information technology Operations (Ops). It describes a set of practices emphasizing the collaboration between both teams, while automating software delivery and infrastructure changes with the ultimate goal of reliability and repeatability of these processes. Automation and repeatability allows for increased deployment frequency, as the manual burden of tending to all of the steps involved in deploying to one or more target environments has been removed. Some organizations use DevOps practices to deploy hundreds of times a day, which would otherwise be nearly impossible. DevOps improves reliability by ensuring each step of the software delivery or infrastructure change process is monitored, and any automated tests successfully pass.
Instrument an application with telemetry
Application Insights is an extensible analytics service for application developers on multiple platforms that helps you understand the performance and usage of your live applications. With it, you can monitor your web application, collect custom telemetry, automatically detect performance anomalies, and use its powerful analytics tools to help you diagnose issues and understand what users actually do with your app. It works with web applications hosted on Azure, on-premises, or in another cloud provider. You can use it from web applications developed on multiple platforms, like .NET, Node.js, and J2EE. To get started, you just need to provision an Application Insights resource in Azure, and then install a small instrumentation package in your application. The things you can instrument are not limited just to the web application, but also any background components, and JavaScript within its web pages. You can also pull telemetry from host environments, such as performance counters, Docker logs, or Azure diagnostics.
Here is a comprehensive list of telemetry that can be collected by Application Insights.
From server web apps:
HTTP requests
Dependencies such as calls to SQL Databases; HTTP calls to external services; Azure Cosmos DB, table, blob storage, and queue
Exceptions and stack traces
Performance Counters, if you use Status Monitor, Azure monitoring, or the Application Insights collected writer
Custom events and metrics that you code
Trace logs if you configure the appropriate collector
From client web pages:
Page view counts
AJAX calls requests made from a running script
Page view load data
User and session counts
Authenticated user IDs
From other sources, if you configure them:
Azure diagnostics
Docker containers
Import tables to Analytics
OMS (Log Analytics)
Logstash
The standard telemetry modules that run “out of the box” when using the Application Insights SDK send load, performance and usage metrics, exception reports, client information such as IP address, and calls to external services. If you install the SDK in development, this allows you to send your own telemetry, in addition to the standard modules. This custom telemetry can include any data you wish to send.
Discover application performance issues by using Application Insights
System performance depends on several factors. Each factor is typically measured through key performance indicators (KPIs), such as the number of database transactions per second or the volume of network requests your application can handle within a specified time frame. You can gather your application’s KPIs through specific performance measures, or a combination of metrics.
Application Insights can help you quickly identify any application failures. It also tells you about any performance issues and exceptions. With the right configuration and tooling, Application Insights can also help you find and diagnose the root causes of slowdowns and failures.
When you open any Application Insights resource you see basic performance data on the overview blade. Clicking on any of the charts allows you to drill down into the related data to see more detail and related requests, as well as viewing different time ranges.
Application Insights offers a full-screen, interactive performance investigator through the Performance blade. The dashboard arranges a set of performance-related metrics that you can use to quickly explore possible performance bottlenecks, and adds additional insights, such as common properties of selected requests. The common properties are the users’ location, performance bucket (in milliseconds), and cloud role of the resource. This information can help you find common variables that affect groups of users, such as response times being lengthier for users coming from certain countries or regions (Figure 4-117).
)
FIGURE 4-117 The Application Insights Performance blade
If your web application is built on ASP.NET or ASP.NET Core, you can turn on Application Insight’s profiling tool to view detailed profiles of live requests. In addition to displaying ‘hot paths’ that are using the most response times, the Profiler shows which lines in the application code slowed down performance. You can view the profile request details to see trace information, showing the call stack through your application. This level of detail allows you to quickly pinpoint issues and address them faster than digging through logs alone. There is little overhead running the profiler because it executes for two minutes per hour, but should provide a satisfactory sample set of data.
To enable the Profiler, follow these steps:
From the Application Insights resource in Azure, select Performance from the left-hand menu.
Select Profiler Rules from the top of the Performance blade.
Select Add Linked Apps from the top of the Configure Application Insights Profiler blade.
Select the application you wish to link to see all its available slots. Click Add to link them to the current Application Insights resource.
After linking your desired apps, select Enable Profiler from the top of the Configure Application Insights Profiler blade. Note, linked applications require Basic or above service plans to enable the profiler (Figure 4-118).
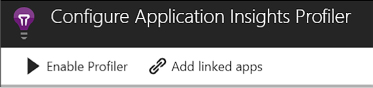
FIGURE 4-118 The Application Insights Profiler actions to add linked apps and enable the Profiler
Deploy Visual Studio Team Services with continuous integration (CI) and continuous development (CD)
Visual Studio Team Services (VSTS) is a collection of hosted DevOps services for application developers, including Build and Release services, which help you manage continuous integration and delivery of your applications.
Continuous Integration (CI) is a practice by which the development team members integrate their work frequently, usually daily. An automated build verifies each integration, typically along with tests to detect integration errors quickly, when it’s easier and less costly to fix. Output, or artifacts, generated by the CI systems are fed to the release pipelines to streamline and enable frequent deployments. The Build service in VSTS helps you set up and manage CI for your applications.
Continuous Delivery (CD) is a process where the full software delivery lifecycle is automated, including tests, and deployed to one or more test and production environments. Azure App Services supports deployment slots, into which you can deploy development, staging, and production builds from the CD process. Automated release pipelines consume the artifacts that the CI systems produce, and deploys them as new versions and fixes to existing systems. Monitoring and alerting systems run continually to drive visibility into the entire CD process. The Release service in VSTS helps you set up and manage CD for your applications.
Because a key component of the Build system is integrating code changes and automating builds, you must host your source code in a version control system. VSTS provides two different version control systems:
Git
Team Foundation Version Control
You can also host your source code in GitHub, Subversion, Bitbucket, or any other Git repository. The Build service can integrate with any one of these options.
VSTS build services provide preconfigured tasks to build many application types, such as .NET, Java, Node, Android, XCode, and C++. You can also run command line, PowerShell, or Shell scripts in your automation to support almost any type of application.
Azure App Services was mentioned earlier as a deployment target for the VSTS Release service. VSTS Release services can deploy to virtual machines, containers, on-premises and cloud platforms, or PaaS services. You can also publish your mobile applications to a store.
The following steps show one way to configure the CI/CD pipeline from the Azure portal (Figure 4-119):
Navigate to the portal accessed via https://portal.azure.com.
Select New on the command bar.
Select Web + Mobile, and then Web App.
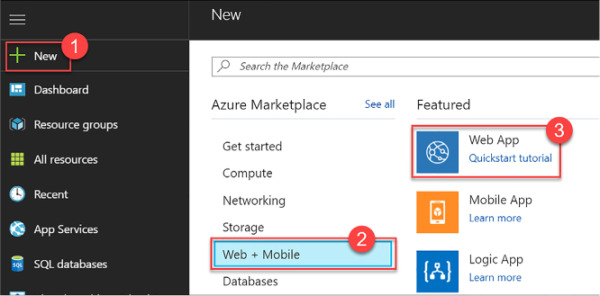
FIGURE 4-119 Completing the Response action form for the new condition’s “If true” block in the Logic App Designer
Provide a unique name for your web app, and then click Create (Figure 4-120).
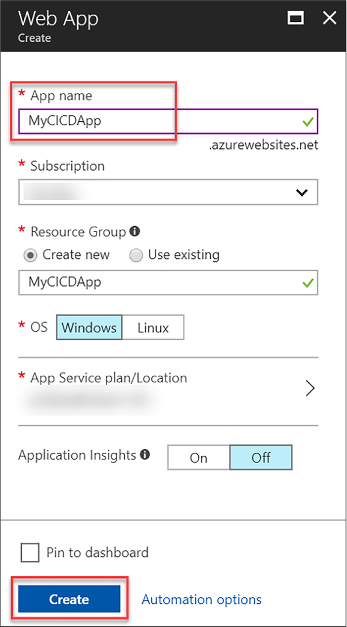
FIGURE 4-120 The create Web App blade
After the new web app is provisioned open it in Azure portal, and then select Continuous Delivery from the left-hand menu. Click Configure on the Continuous Delivery blade (Figure 4-121).
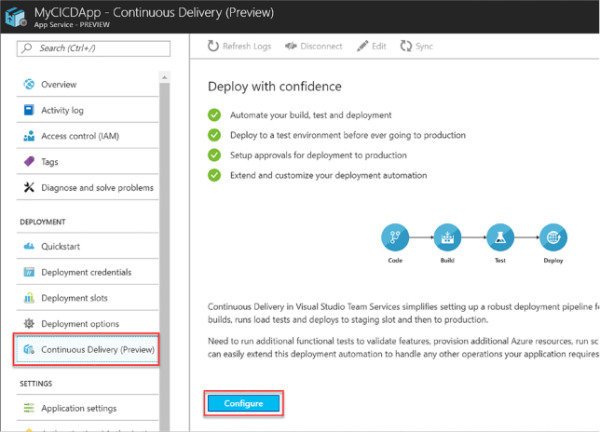
FIGURE 4-121 The Continuous Delivery blade on the provisioned web app
Select Choose repository, and then select VSTS for the code repository. Select the VSTS account, project, repository, and source code branch from which you wish to deploy. Click OK (Figure 4-122).
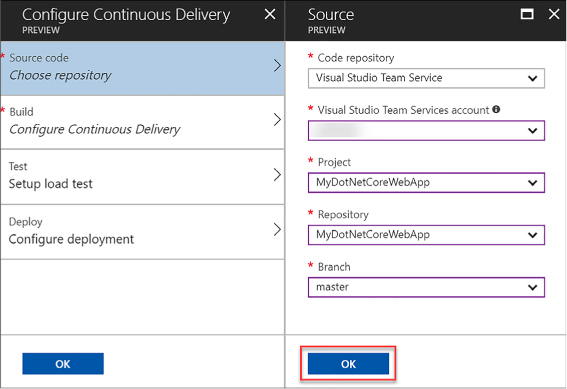
FIGURE 4-122 The Continuous Delivery source code configuration options
Select Configure Continuous Delivery, and then your web application framework. In our example, we selected ASP.NET Core. Click OK. Skip the other two steps for now, and then click OK to complete the configuration (Figure 4-123).
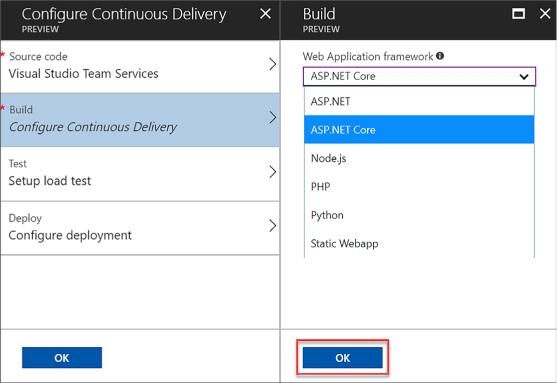
FIGURE 4-123 The Continuous Delivery build options
At this point, Azure Continuous Delivery configures and executes a build and deployment in VSTS. After the build completes, the deployment is automatically initiated. When you commit a change to the source code repository, the automated deployment appears in the Continuous Delivery application logs on your web app, as shown in Figure 4-124.
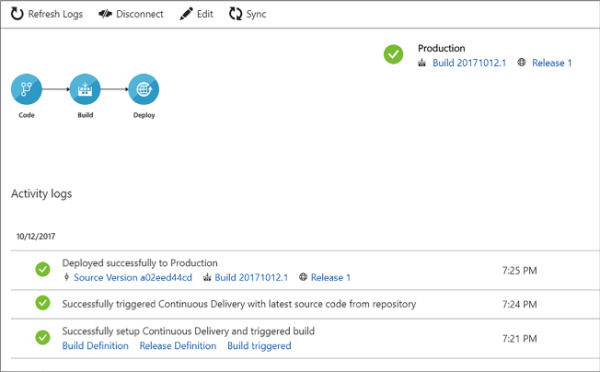
FIGURE 4-124 The Continuous Delivery blade with activity logs showing the initial build
)
)
)
)
)
)
)
Deploy CI/CD with third-party platform tools (Jenkins, GitHub, Chef, Puppet, TeamCity)
Azure allows you to continuously integrate and deploy with any of the leading DevOps tools, targeting any Azure service. Whether you are following your organization’s established CI/CD procedures, or just getting started with DevOps, use the tools best-suited for your team.
If you are using VSTS to host your source code or as your CI service, you can use various build services, like Jenkins, through service hooks. In this way, you can use Jenkins for your continuous integration builds, or use both VSTS and Jenkins as for building parts of your solution. Refer to this tutorial for more information: https://docs.microsoft.com/vsts/service-hooks/services/jenkins.
In addition, Table 4-5 lists some popular DevOps tools that work with Azure.
TABLE 4-5 References for using third-party DevOps tools with Azure
Out of the box, Azure App Services integrates with source code repositories such as GitHub to enable a continuous deployment workflow. This is the simplest way to integrate a CD process without the need for installing and configuring additional tools and services. Follow these simple steps to enable continuous deployment from a GitHub repository:
Publish your application source code to GithHub.
Open your app’s Menu blade in the Azure portal, and then select Deployment Options under Deployment in the left-hand menu.
In the Deployment option blade, select Choose Source, and then select GitHub from the list of sources.
Select Authorization, and then click the Authorize button to enter your GitHub credentials. When authorized, click OK.
In the Deployment Option blade, select your project and branch from which you wish to deploy your app, and click OK.
App Service creates an association with the selected repository, pulls in the files from the specified branch, and maintains a clone of your repository for your App Service app. Now, when you push a change to your repository, your app is automatically updated with the latest changes. More information about this process can be found at: https://docs.microsoft.com/azure/app-service/app-service-continuous-deployment.