Aggregating and Pivoting Data in Microsoft SQL Server 2008 T-SQL
- 3/25/2009
Grouping Factor
In earlier chapters, Chapter 6 in particular, I described a concept called a grouping factor. I used it in a problem to isolate islands, or ranges of consecutive elements in a sequence. Recall that the grouping factor is the factor you end up using in your GROUP BY clause to identify the group. In the earlier problem, I demonstrated two techniques to calculate the grouping factor. One method was calculating the maximum value within the group (specifically, the smallest value that is both greater than or equal to the current value and followed by a gap). The other method used row numbers.
Because this chapter covers aggregates, it is appropriate to revisit this very practical problem. In my examples here, I’ll use the Stocks table, which you create and populate by running the following code:
USE tempdb;

IF OBJECT_ID('Stocks') IS NOT NULL DROP TABLE Stocks;

CREATE TABLE dbo.Stocks
(
  dt    DATE NOT NULL PRIMARY KEY,
  price INT  NOT NULL
);
GO

INSERT INTO dbo.Stocks(dt, price) VALUES
  ('20090801', 13),
  ('20090802', 14),
  ('20090803', 17),
  ('20090804', 40),
  ('20090805', 40),
  ('20090806', 52),
  ('20090807', 56),
  ('20090808', 60),
  ('20090809', 70),
  ('20090810', 30),
  ('20090811', 29),
  ('20090812', 29),
  ('20090813', 40),
  ('20090814', 45),
  ('20090815', 60),
  ('20090816', 60),
  ('20090817', 55),
  ('20090818', 60),
  ('20090819', 60),
  ('20090820', 15),
  ('20090821', 20),
  ('20090822', 30),
  ('20090823', 40),
  ('20090824', 20),
  ('20090825', 60),
  ('20090826', 60),
  ('20090827', 70),
  ('20090828', 70),
  ('20090829', 40),
  ('20090830', 30),
  ('20090831', 10);

CREATE UNIQUE INDEX idx_price_dt ON Stocks(price, dt);
The Stocks table contains daily stock prices.
NOTE

Stock prices are rarely restricted to integers, and there is usually more than one stock, but I’ll use integers and a single stock for simplification purposes. Also, stock markets usually don’t have activity on Saturdays; because I want to demonstrate a technique over a sequence with no gaps, I introduced rows for Saturdays as well, with the same value that was stored in the preceding Friday.
The request is to isolate consecutive periods where the stock price was greater than or equal to 50. Figure 8-2 has a graphical depiction of the stock prices over time, and the arrows represent the periods you’re supposed to return.
)
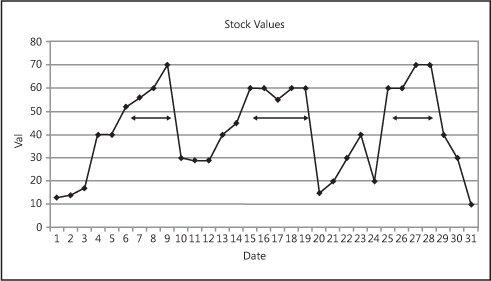
Figure 8-2 Periods in which stock values were greater than or equal to 50
For each such period, you need to return the starting date, ending date, duration in days, and the peak (maximum) price.
Let’s start with a solution that does not use row numbers. The first step here is to filter only the rows where the price is greater than or equal to 50. Unlike the traditional problem where you really have gaps in the data, here the gaps appear only after filtering. The whole sequence still appears in the Stocks table. You can use this fact to your advantage. Of course, you could take the long route of calculating the maximum date within the group (the first date that is both later than or equal to the current date and followed by a gap). However, a much simpler and faster technique to calculate the grouping factor would be to return the first date that is greater than the current, on which the stock’s price is less than 50. Here, you still get the same grouping factor for all elements of the same target group, yet you need only one nesting level of subqueries instead of two.
Here’s the query:
SELECT MIN(dt) AS startrange, MAX(dt) AS endrange,
  DATEDIFF(day, MIN(dt), MAX(dt)) + 1 AS numdays,
  MAX(price) AS maxprice
FROM (SELECT dt, price,
        (SELECT MIN(dt)
         FROM dbo.Stocks AS S2
         WHERE S2.dt > S1.dt
          AND price < 50) AS grp
      FROM dbo.Stocks AS S1
      WHERE price >= 50) AS D
GROUP BY grp;
This query generates the following output, which is the desired result:
startrange endrange   numdays     maxprice
---------- ---------- ----------- -----------
2009-08-06 2009-08-09 4           70
2009-08-15 2009-08-19 5           60
2009-08-25 2009-08-28 4           70
Of course, post filtering, you could consider the problem as a classic islands problem in a temporal sequence scenario and address it with the very efficient technique that uses the ROW_NUMBER function, as I described in Chapter 6:
SELECT MIN(dt) AS startrange, MAX(dt) AS endrange,
  DATEDIFF(day, MIN(dt), MAX(dt)) + 1 AS numdays,
  MAX(price) AS maxprice
FROM (SELECT dt, price,
        DATEADD(day, -1 * ROW_NUMBER() OVER(ORDER BY dt), dt) AS grp
      FROM dbo.Stocks AS S1
      WHERE price >= 50) AS D
GROUP BY grp;